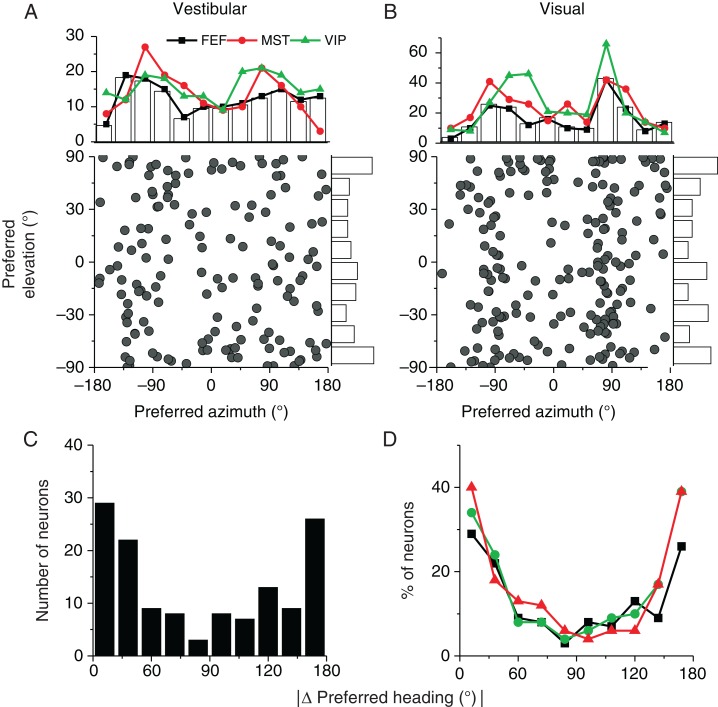
Figure 5.
Heading preferences in FEFsem. (A and B) Scatter plot and marginal distributions of azimuth (abscissa) and elevation (ordinate) coordinates of heading preferences in the vestibular (n = 148) and visual (n = 194) conditions, respectively. Marginal bar graphs and black curves show distributions from FEFsem, while red and green curves show data from MSTd (vestibular, n = 162; visual, n = 280) and VIP (vestibular, n = 187; visual, n = 302), respectively. (C) Distribution of the absolute difference in 3D heading preferences between vestibular and visual conditions for FEFsem (n = 134). (D) Comparison of the absolute difference in vestibular and visual heading preferences among 3 cortical areas: FEFsem (black, n = 134), MSTd (red, n = 161), and VIP (green, n = 159). Since different numbers of neurons were recorded in each area, the ordinate represents percentage of cells. In C and D, only cells with significant heading tuning for both the vestibular and visual conditions were included.

