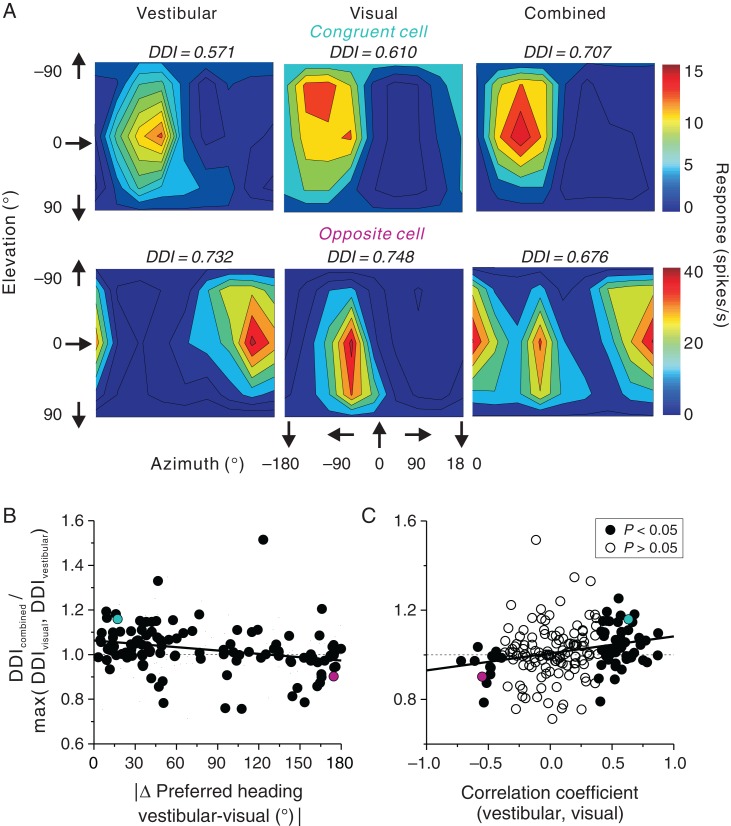
Figure 7.
Vestibular-visual integration in area FEFsem. (A) Contour maps of 3D heading tuning for 2 example neurons (top: congruent cell; bottom: opposite cell) during the vestibular, visual, and combined conditions. (B) Ratio of the combined DDI over the maximum of the single-cue DDI values is plotted as a function of the absolute difference in heading preference between visual and vestibular conditions (n = 113, only neurons with significant tuning are included). (C) Ratio of the combined DDI over the maximum of the single-cue DDI values is plotted as a function of the correlation coefficient between visual and vestibular tuning curves (n = 186). Filled circles represent significant congruent cells (n = 55, r > 0, P < 0.05, Pearson correlation coefficient) or opposite cells (n = 13, r < 0, P < 0.05) and open circles represent cells not assigned to either group (n = 118, P > 0.05). The cyan and magenta circles represent the neurons shown in A. Solid lines represent results of a type II linear regression. Notice that positive values on the x-axis in C and small values on the x-axis in B both represent congruent cells; thus, the opposite trends in B and C are expected.

