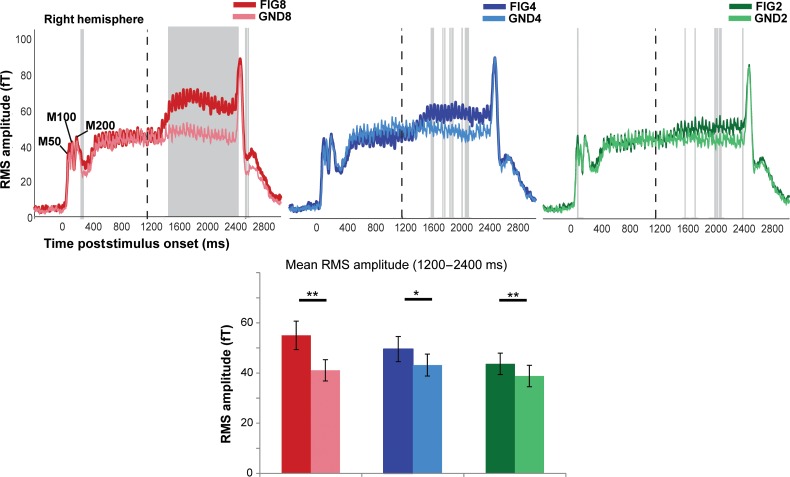
Figure 3.
MEG evoked responses to the noise SFG stimulus. (Top) Each plot depicts the group-RMS response to the noise SFG stimulus in the right hemisphere (left hemisphere responses are identical). The onset of the stimulus occurs at t = 0 and offset at t = 2400 ms, the transition to the figure, as indicated by the dashed vertical lines, occurs at t = 1200 ms. The responses to the figure and ground segments are shown in the darker and lighter shade of each color: red (FIG8 and GND8), blue (FIG4 and GND4), green (FIG2 and GND2). The shaded gray bars indicate times where a significant difference between the response to the figure and its corresponding control stimulus was observed (based on bootstrap analysis; see Materials and Methods). (Bottom) Mean RMS amplitude in each of the conditions computed over the figure interval (between 1200 and 2400 ms poststimulus onset). A repeated-measures ANOVA analysis indicated significant differences between each FIG and GND pair. ** indicates P ≤ 0.01; * indicates P > 0.02.

