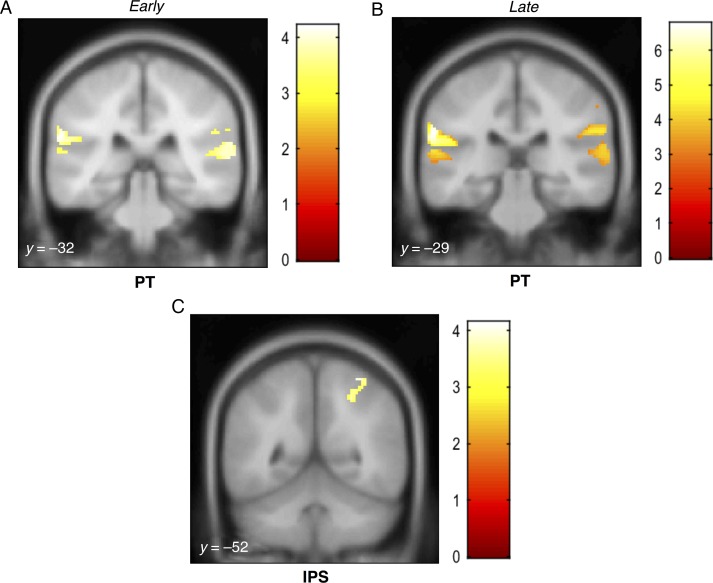
Figure 6.
MEG source activations as a function of coherence for the noise SFG stimulus. Activations (thresholded at P < 0.001, uncorrected) are shown on the superior temporal plane of the MNI152 template image, and the corresponding y coordinates are overlaid on each image. The heat map adjacent to each figure depicts the t value. Coordinates of local maxima are provided in Table 2. Maximum response during the early transition period was observed in the right PT and left MTG (A). Significant activity during the late response period was observed in the PT bilaterally as well as the right precentral gyrus and rolandic operculum (B) and in the left IPS (C).

