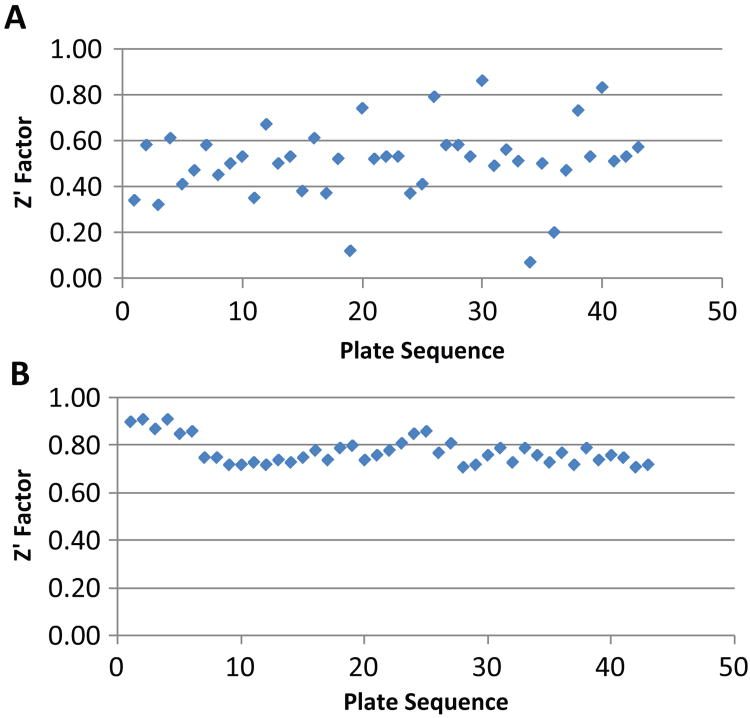
Figure 1.
Z′ factor values from a 320 siRNA plate before and after troubleshooting and assay optimization. (A) Z′ analysis before troubleshooting with Z′ factor value of 0.51 ± 0.16 (average ± standard deviation), n = 43. (B) Z′ data after troubleshooting showing a robust Z′ factor value of 0.78 ± 0.06 (average ± standard deviation), n = 43.

