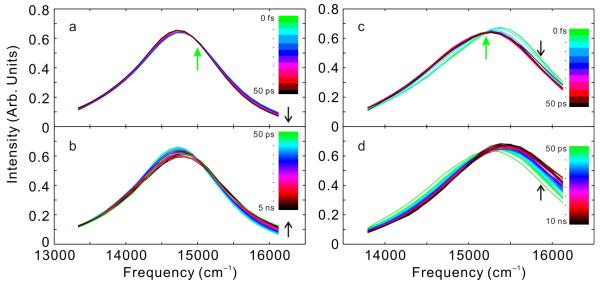
Figure 3.
TRANES spectra constructed from femtosecond and picosecond TRFS (a) TagRFP675 from 0 to 50 ps and (b) TagRFP675 from 50 ps to 5 ns (c) mKate/M41Q from 0 to 50 ps and (d) mKate/M41Q from 50 ps to 10 ns. Actual times for each curve can be obtained from the dots in Figure S5. Time increases in the direction of the black arrows. The green arrows indicate isoemissive points.

