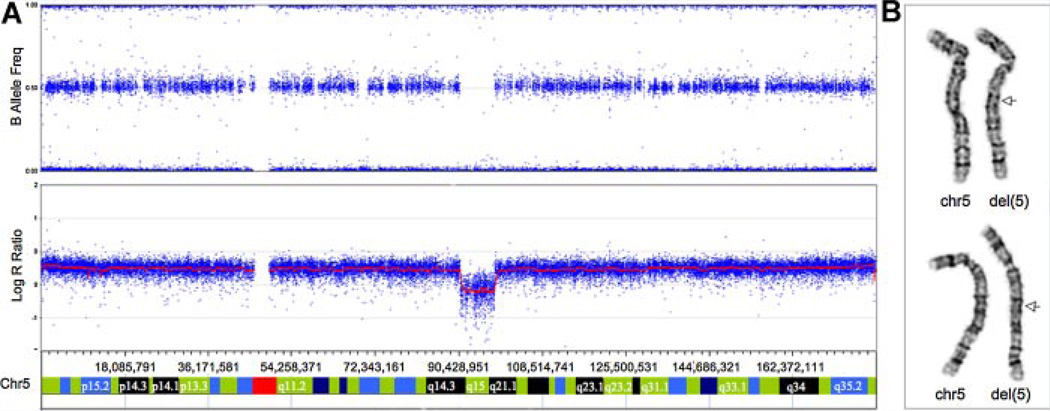
FIG. 2.
Panel A: full view of chromosome 5 analyzed by Illumina 610,000 SNP array showing signal intensity values (Log R ratio) and frequency of B allele; the red line represents the smoothed intensity data; the blue data points are the values of each individual SNP for the B allele frequency. Note absence of AB allele frequency calls in deleted region and decrease in intensity data. Panel B–G-banded chromosomes 5; note the 5q deletion indicated by an arrow. [Color figure can be viewed in the online issue, which is available at www.interscience.wiley.com.]

