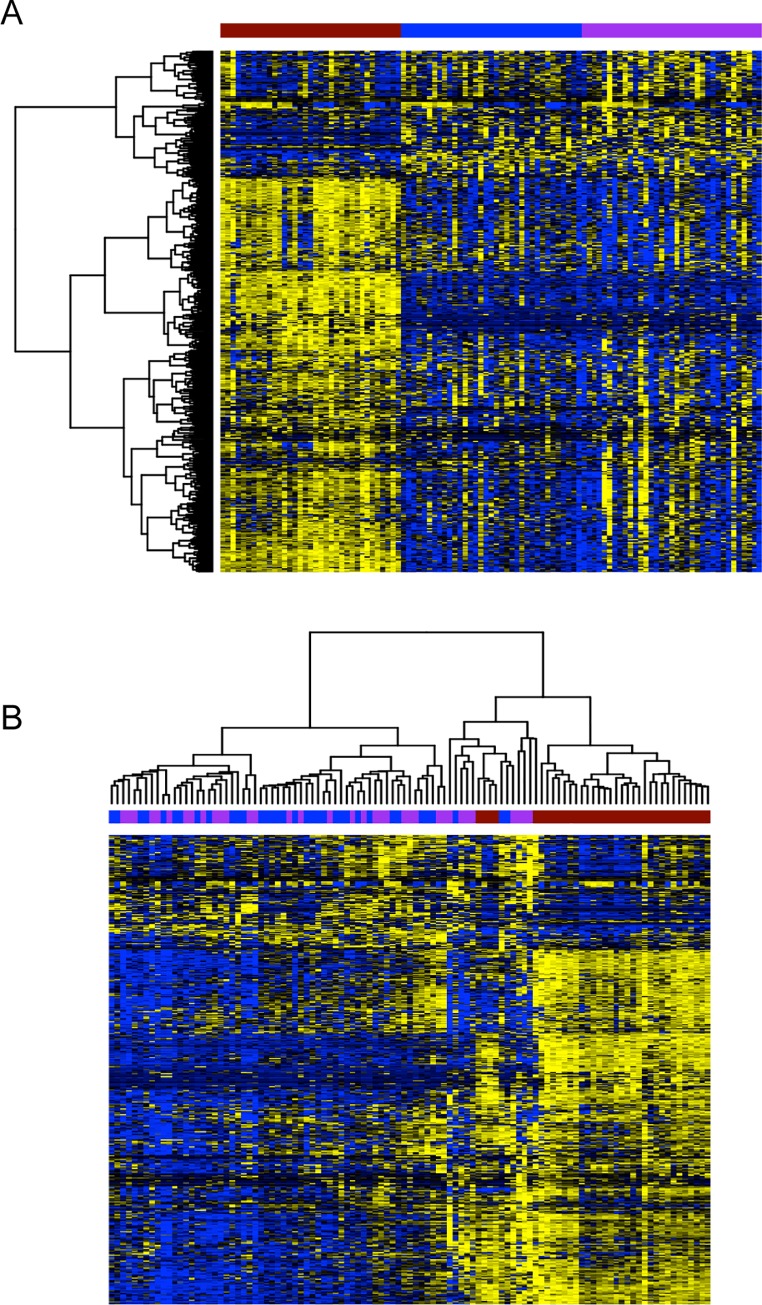
Fig 1.
Clustering of kinase genes showing A) normal tissue on the left (N, red), tumor in the middle (T, blue) and metastatic tumor tissue on the right (M, purple), and B) hierarchical clustering of all normal (N, red), tumor (T, blue), and metastatic (M, purple) tissues. Figure legend: X-axis represents the tissue sample, Y-axis represents the kinases. Yellow: up regulated kinases, Blue: down regulated kinases.

