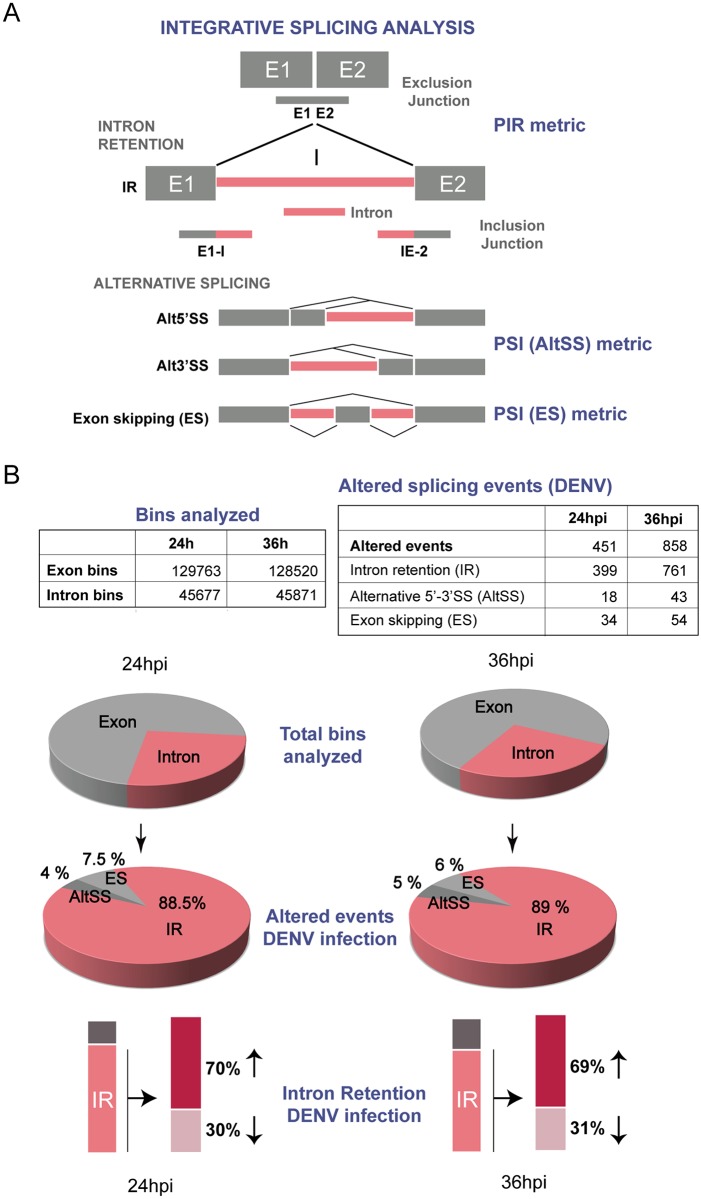
Fig 8. Decreased splicing efficiency in DENV infected cells.
(A) Schematic representation of splicing analysis. The four splicing events analyzed are shown: Intron retention (IR), Exon skipping (ES), Alternative splice site donor/acceptor (Alt5’SS and Alt3’-SS). Constitutive exon and alternative 5’ and 3’SS regions are shown in grey and intron regions in pink. For intron retention the information of the junctions (E1-I, IE-2 and E1E2) was used to calculate the PIR metric. For ES and AltSS the PSI metric was used (see Materials and methods). (B) Data of splicing analysis of DENV or mock infected cells. On the upper panels, total amount of bins analyzed and altered splicing events for each time point post infection (24 and 36 hours). The percentage of altered events (ES, ALtSS and IR) is shown in pie charts. On the lower panel, increase or decrease retention of introns for each time point is shown.

