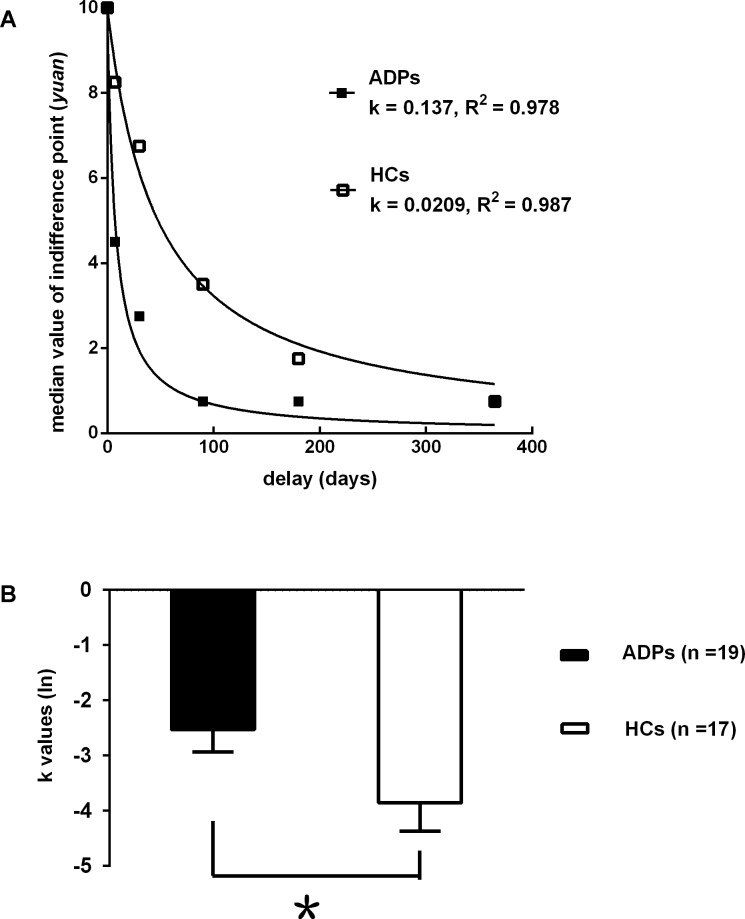
Fig 1.
(A) Delay discounting in ADPs and HCs. Data points represent the median indifference points at each time delay. The lines reflect the best fit of the hyperbolic function V = 10/(1+k*D) to the median group indifference points. The rate of discounting for each group (k value) and the goodness of fit for both function are also shown. (B) Mean (ln) k-values when the hyperbolic function is fitted to the data for each subject.Smaller (ln) k-values indicate greater discounting. Err bars represent SEM. The distribution of k values was extremely positively skewed and leptokurtic and the group variances were significantly heterogeneous. Therefore, a natural logarithm (ln) transformation was computed before performing the t test analyses. *p < 0.05 compared with HCs.

