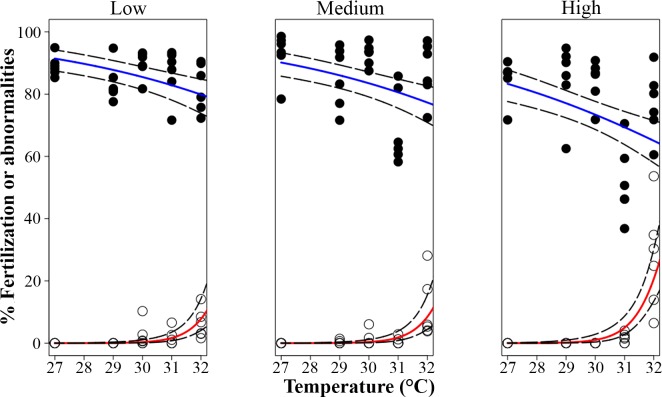
Fig 2.
Effects of temperature and nutrient enrichment on the percentage of fertilized eggs (blue line, black circles; Experiment 1a) and abnormal embryos (red line, open circles; Experiment 1b) of Acropora tenuis. Control treatment: ‘low’ nutrient enrichment and at temperature = 27°C. Solid lines indicate fitted GLM trend lines, while dashed lines are 95% confidence intervals.

