Fig 5. Four-month-old Acropora tenuis juveniles.
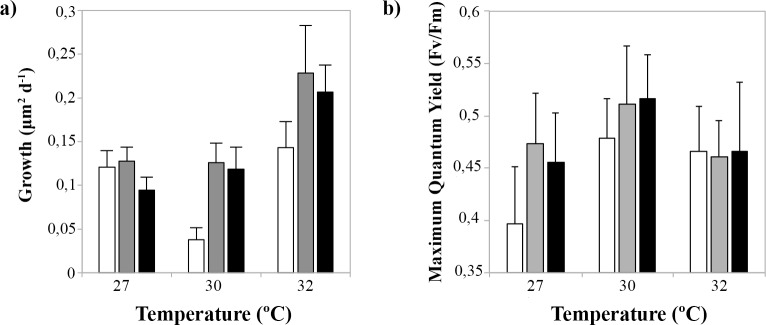
a) Growth rates (mean ± sd) under different temperatures and nutrient enrichment [low (white bars), medium (grey bars), high (black bars)], b) maximum quantum yields (Fv/Fm, mean ± sd) under different temperatures and nutrient enrichment (Experiment 3). Control treatment: ‘low’ nutrient enrichment and at temperature = 27°C.

