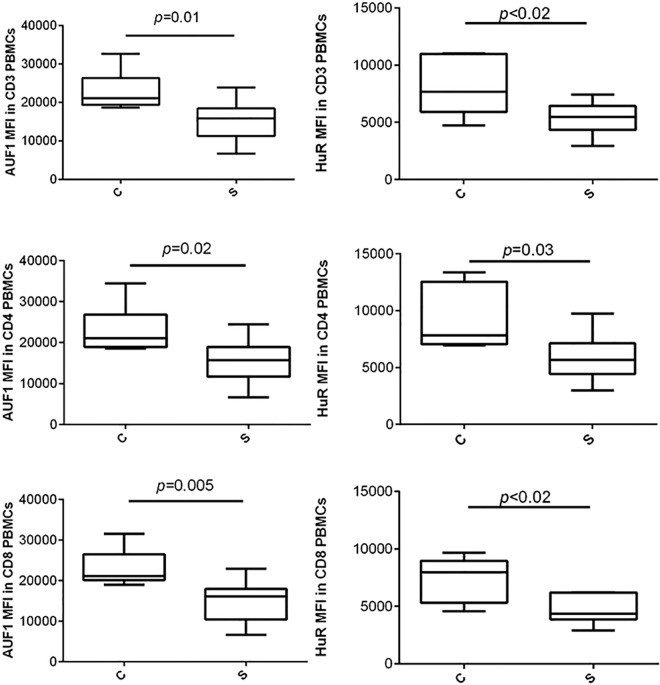
Fig 2. AUF1 and HuR protein expressions in CD3+, CD4+ and CD8+ T lymphocytes of peripheral blood obtained from the patients with pulmonary sarcoidosis and healthy controls.
Legend: PBMC, peripheral blood mononuclear cells; MFI, mean fluorescence intensity. The data are expressed as whisker box plots; the box represents the 25–75th percentiles, the median is indicated by a bar across the box, the whiskers on each box represent the 10–90th percentiles.

