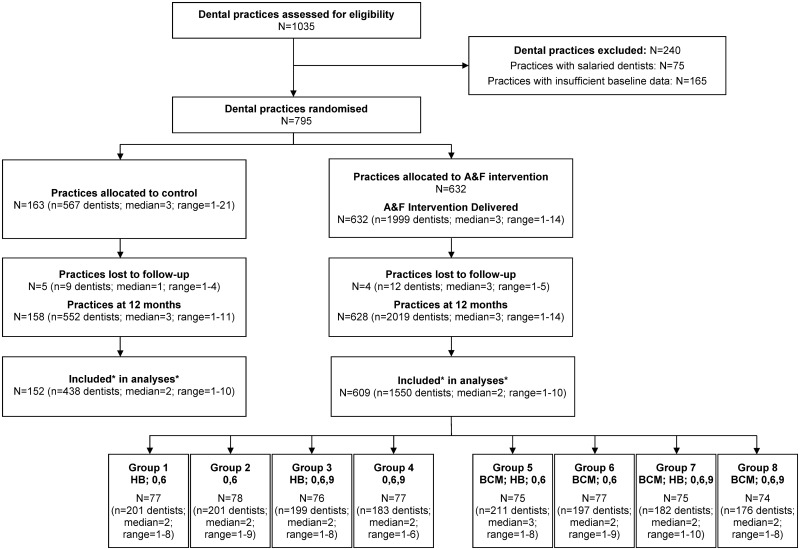
Fig 2. Practice and dentist flow diagram.
Abbreviations: A&F—audit and feedback comprising a line graph plotting an individual dentist’s monthly antibiotic prescribing rate. BCM—written behaviour change message comprising text added below a dentist’s individualised line graph synthesising and reiterating national guidance recommendations for antibiotic prescribing. HB—health board comparator comprising addition of a line to the individualised line graph plotting the monthly antibiotic prescribing rate of all dentists in that dentist’s health board. 0,6—allocated intervention delivered at months 0 and 6. 0,6,9—allocated intervention delivered at months 0, 6, and 9. Trial Comparisons: Groups 1,2,3,4 versus Groups 5,6,7,8 test the written behaviour change message main effect. Groups 1,3,5,7 versus Groups 2,4,6,8 test the health board comparator main effect. Groups 1,2,5,6 versus Groups 3,4,7,8 test the frequency of feedback main effect. Dentists without both baseline and follow-up data were not included in the analyses (control n = 114; intervention n = 469). Practices without at least one dentist with both baseline and follow-up data were not included in the analysis (control n = 6; intervention n = 19).

