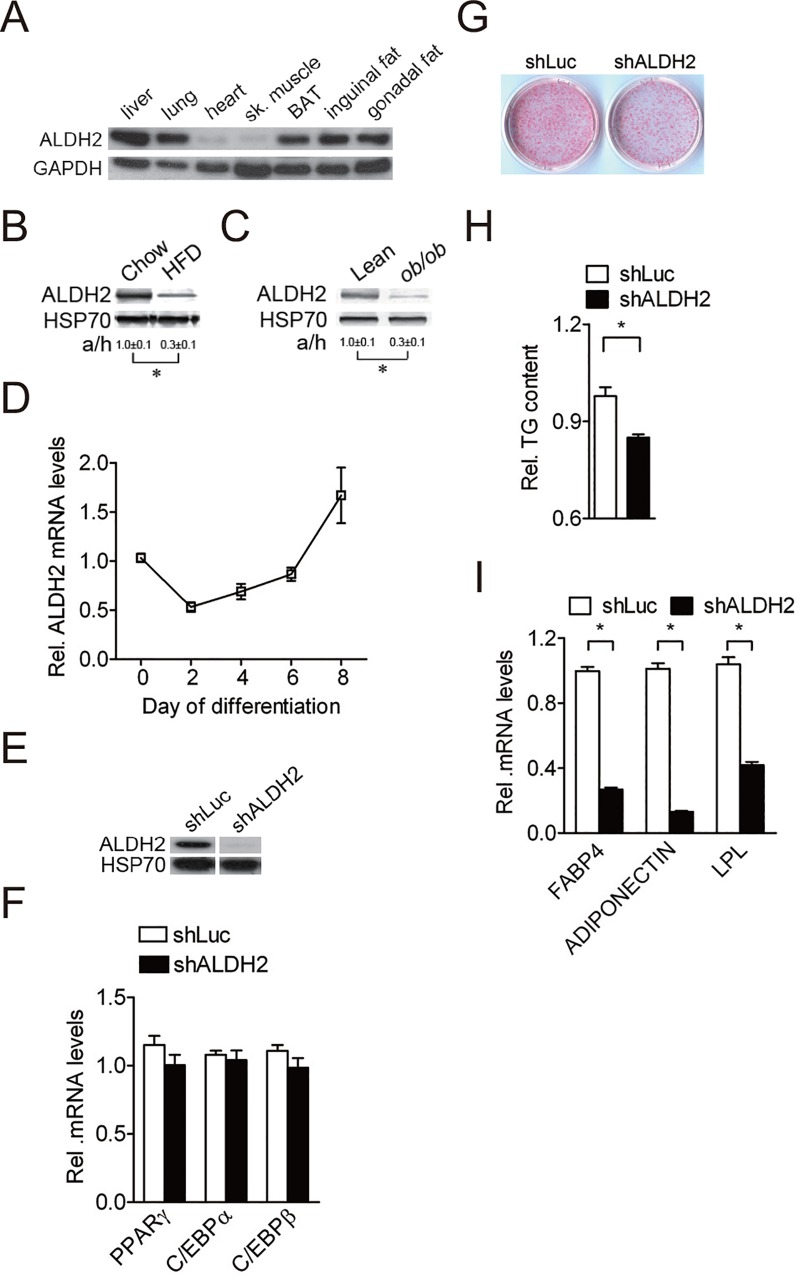
Fig 1. ALDH2 is a positive regulator of adipocyte differentiation.
A, Tissue distribution of ALDH2 protein from 12-wk-old male mice C57BL/6 mice (n = 3 independent experiments). The results shown are representative of an individual experiment. B, Expression of ALDH2 protein from adipose tissue of 12-wk-old male chow/HFD-fed mice (n = 4 independent experiments). 4-wk-old mice C57BL/6 mice were randomly divided into two groups: a control group, which was fed a chow diet (Chow), and a high-fat diet group, which was fed a high-fat diet (HFD). The results shown are representative of an individual experiment. The ratio of intensity of bands corresponding to target protein per loading control was analyzed by densitometer software. The numbers indicate the means ± SE. * P < 0.05 versus chow diet group. C, Expression of ALDH2 protein from white adipose tissue of 12-wk-old male lean and ob/ob mice (n = 4 independent experiments). The results shown are representative of an individual experiment. The ratio of intensity of bands corresponding to target protein per loading control was analyzed by densitometer software. The numbers indicate the means ± SE. * P < 0.05 versus lean mice. D, Expression of ALDH2 mRNA during induced 3T3-L1 adipocyte differentiation. Data are shown as mean ± SE from 3 independent experiments. E, Efficiency of shRNA control (shLuc) and ALDH2 shRNA (shALDH2) targeted on mouse ALDH2 protein levels of 3T3-L1 cells. Data are shown as mean ± SE from 3 independent experiments. F, Expression of adipogenic transcription factor genes (PPARγ, C/EBPα and C/EBPβ) in shRNA control (shLuc) and ALDH2-knockdown cells after 2 day induction. Data are shown as mean ± SE from 3 independent experiments. G, Oil-Red O staining of shRNA control and ALDH2-knockdown cells during adipocyte differentiation (n = 3 independent experiments). The results shown are representative of an individual experiment. H, Quantification of Oil-Red O in shLuc control and ALDH2-knockdown cells during adipocyte differentiation. Data are shown as mean ± SE from 3 independent experiments. * P < 0.05 versus shLuc. I, Expression of adipogenic genes (FABP4, ADIPONECTIN and LPL) in shRNA control and ALDH2-knockdown cells during adipocyte differentiation. Data are shown as mean ± SE from 3 independent experiments. * P < 0.05 versus shLuc.

