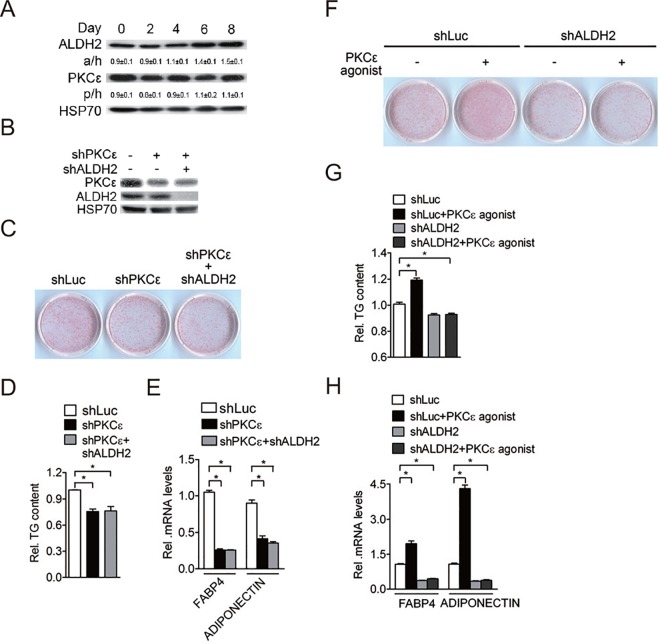
Fig 3. Adipogenesis is regulated by PKCε-ALDH2 axis.
A, Expression of ALDH2 and PKCε protein during induced 3T3-L1 adipocyte differentiation (n = 3 independent experiments). The results shown are representative of an individual experiment. The ratio of intensity of bands corresponding to target protein per loading control was analyzed by densitometer software. The numbers indicate the means ± SE. B, Efficiency of shRNA control (shLuc), PKCε shRNA and ALDH2 shRNA targeted on mouse PKCε and ALDH2 protein levels of 3T3-L1 cells (n = 3 independent experiments). The results shown are representative of an individual experiment. C, 3T3-L1 preadipocytes expressing indicated lentiviral vectors were maintained in induction medium for 2 days. After 8 day of adipogenic stimulation, cells on the plates were stained with Oil-Red O. D, Quantification of Oil-Red O dye in shRNA control, PKCε-knockdown and double knockdown of PKCε and ALDH2 preadipocytes after 8 day induction. E, Determination of adipogenic gene (FABP4 and ADIPONECTIN) expression in shRNA control, PKCε-knockdown and double knockdown of PKCε and ALDH2 preadipocytes after 8 day induction. Data are shown as mean ± SE from 3 independent experiments. * P < 0.05 versus shLuc. F, shRNA control and ALDH2-knockdown preadipocytes were maintained in induction medium with or without 1 μM PKCε agonist for 2 days. After 8 day of adipogenic stimulation, cells on the plates were stained with Oil-Red O. G, Quantification of Oil-Red O dye in shRNA control, PKCε-knockdown and double knockdown of PKCε and ALDH2 preadipocytes with or without 1 μM PKCε agonist treatment after 8 day induction. H, Determination of adipogenic gene (FABP4 and ADIPONECTIN) expression in shRNA control, PKCε-knockdown and double knockdown of PKCε and ALDH2 preadipocytes with or without 1 μM PKCε agonist treatment after 8 day induction. Data are shown as mean ± SE from 3 independent experiments. * P < 0.05 versus shLuc.

