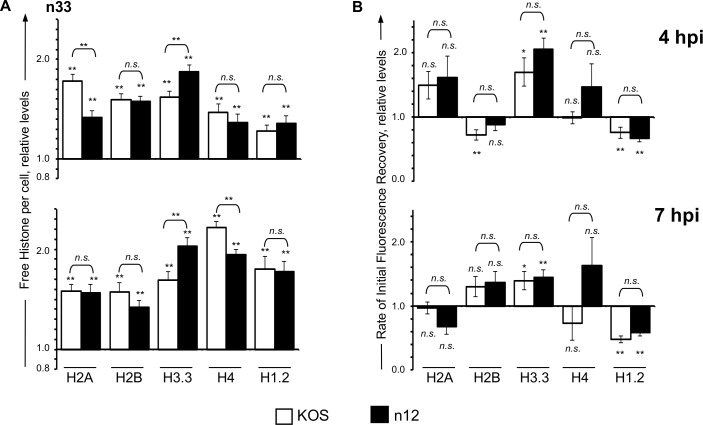
Fig 3. Functional ICP4 enhances histone dynamics during n12 infection.
n-33 cells transfected with plasmids expressing GFP fused to H2A, H2B, H3.3, H4, or H1.2 were mock infected or infected with 30 PFU per cell of HSV-1 strain KOS (☐) or n12 (■). Histone dynamics were evaluated from 4 to 5 (4 hpi) or 7 to 8 (7 hpi) hpi by FRAP. A) Bar graphs showing the average levels of free GFP-H2A, -H2B, -H3.3, -H4, or -H1.2 in KOS- or n12- infected cells relative to those in mock-infected cells (set at 1.0) at 4 or 7 hpi. B) Bar graphs showing the average initial rates of normalized fluorescence recovery (core histones) or the average T50 (H1.2) in KOS- or n12- infected cells relative to those in mock-infected cells (set at 1.0) at 4 or 7 hpi. Error bars, SEM. **, P < 0.01; *, P < 0.05; n.s., not significant. n ≥ 15 cells from at least 2 independent experiments, except GFP-H2A and -H4 n ≥ 8 cells from 1 experiment.

