Fig. 7.
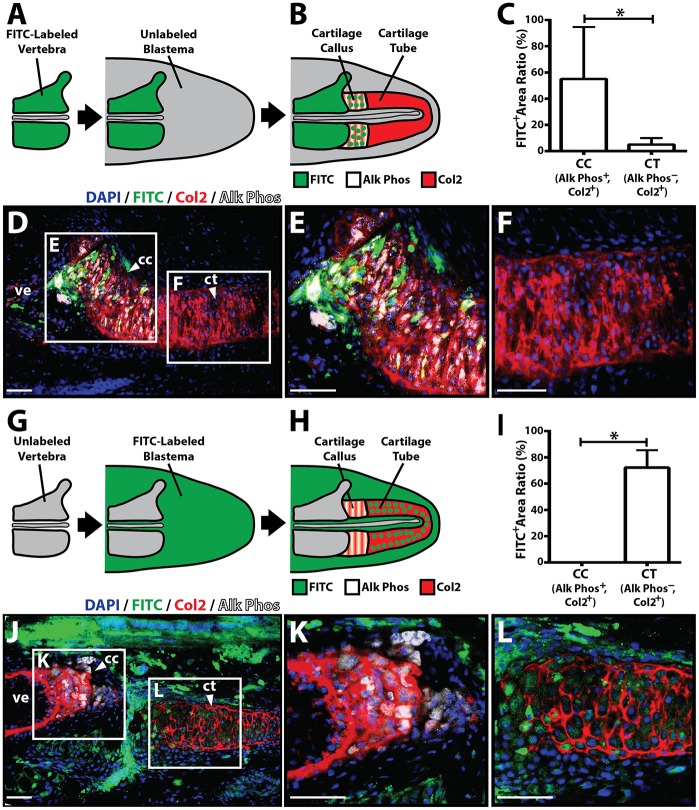
Vertebral and blastema cells fate map to proximal and distal regenerate lizard tail skeletal regions, respectively. (A,B) Experimental scheme used to fate map vertebral-derived cartilage regions. (A) FITC-labeled vertebrae were implanted into unlabeled blastema explants. (B) After 2 weeks, during which time CCs/CTs formed, samples were co-immunostained for Alk Phos and Col2 to determine whether FITC-labeled cells traced to Alk Phos+ Col2+ cartilage callus (CC) regions or Alk Phos− Col2+ cartilage tube (CT) regions. (C) Areas of FITC+, Alk Phos+ and Col2+ regions were quantified using ImageJ and compared between Alk Phos+ Col2+ CC regions and Alk Phos− Col2+ CT regions (n=5). *P<0.05; Student's t-test. (D) Representative unlabeled blastema sample implanted with FITC-labeled vertebra following 2 weeks of explant culture and analyzed for FITC, Col2 and Alk Phos expression. (E,F) Higher magnification views of CC (E) and CT (F) regions identified in D. (G,H) Experimental scheme used to fate map blastema-derived cartilage regions. (G) Unlabeled vertebrae were implanted into FITC-labeled blastema explants. (H) Resultant CCs/CTs were analyzed for Col2 and Alk Phos expression to identify cartilage regions derived from blastemal cells. (I) Quantification of FITC+ areas within Alk Phos+ Col2+ CC regions and Alk Phos− Col2+ CT regions (n=5). *P<0.05; Student's t-test. (J) Representative cultured FITC-labeled blastema sample implanted with unlabeled vertebra and analyzed for FITC, Col2 and Alk Phos expression. (K,L) Higher magnification views of CC (K) and CT (L) regions identified in J. Data are mean±s.d. cc, cartilage callus; ct, cartilage tube; ve, vertebra. Scale bars: 25 µm.

