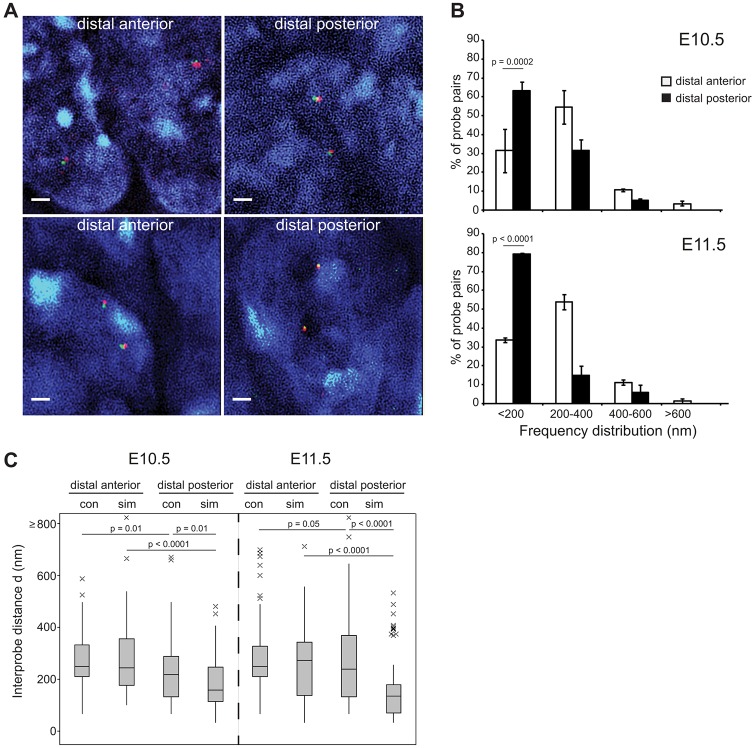
Fig. 2.
Super-resolution imaging identifies the majority of Shh-ZRS probes as colocalised in ZPA tissue. (A) Nuclei captured by super-resolution SIM imaging from the distal forelimb of E10.5 (top row) and E11.5 (bottom row) embryos after FISH with Shh and ZRS probe pairs. Scale bars: 1 μm. (B) Frequency distributions of Shh-ZRS inter-probe distances (d) measured from SIM images in 200 nm bins, in distal anterior and distal posterior regions of the murine forelimb at E10.5 and E11.5. n=67-100 (alleles). Error bars represent s.e.m. obtained from two different tissue sections from one embryo. The statistical significance between data sets was examined by Fisher's exact tests. (C) Boxplots show the distribution of Shh-ZRS inter-probe distances (d in nm) in E10.5 and E11.5 distal anterior and distal posterior limb tissue captured by conventional (con) and structured illumination (sim) microscopy. Line, median; box, interquartile range; whiskers, 95% range. The statistical significance between data sets was examined by Mann–Whitney U tests.

