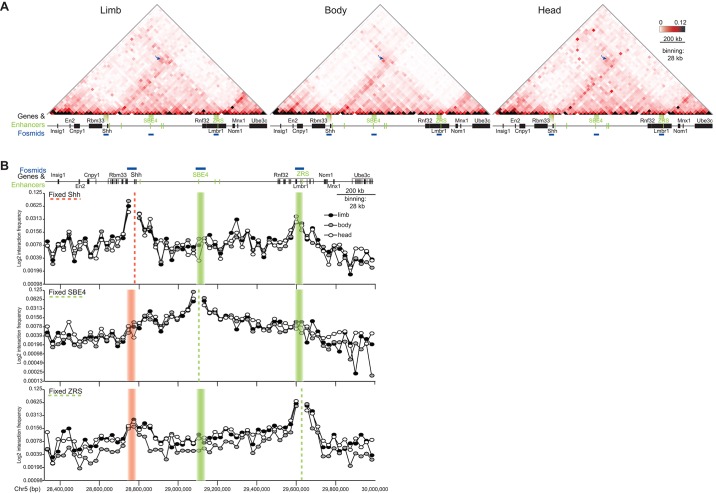
Fig. 4.
5C-seq identifies enriched interactions between Shh and ZRS in E11.5 embryos. (A) Heat maps showing 5C data from cells of the limbs, bodies and heads of E11.5 embryos, across the 1.7-Mb Shh region shown in Fig. 1. Heat-map intensities represent the average of interaction frequency for each window, colour-coded according to the scale shown. Interaction frequencies were normalised based on the total number of sequence reads in the 5C data set and the data shown is binned over 28-kb windows. Arrows indicate interaction frequencies between windows containing Shh and ZRS. Data for biological replicates are in Fig. S3A and unprocessed normalised data are shown in Fig. S4. (B) Virtual 4C analysis obtained by extracting 5C interactions with viewpoints fixed at Shh, SBE4 and ZRS. Dashed lines indicate the position of the fixed viewpoint from the Shh genomic region (pink) or regulatory elements (green). Data from limbs are in black filled circles, bodies in grey filled circles and heads in unfilled circles. Genome coordinates on chromosome 5 (Chr5) are from the mm9 assembly of the mouse genome.

