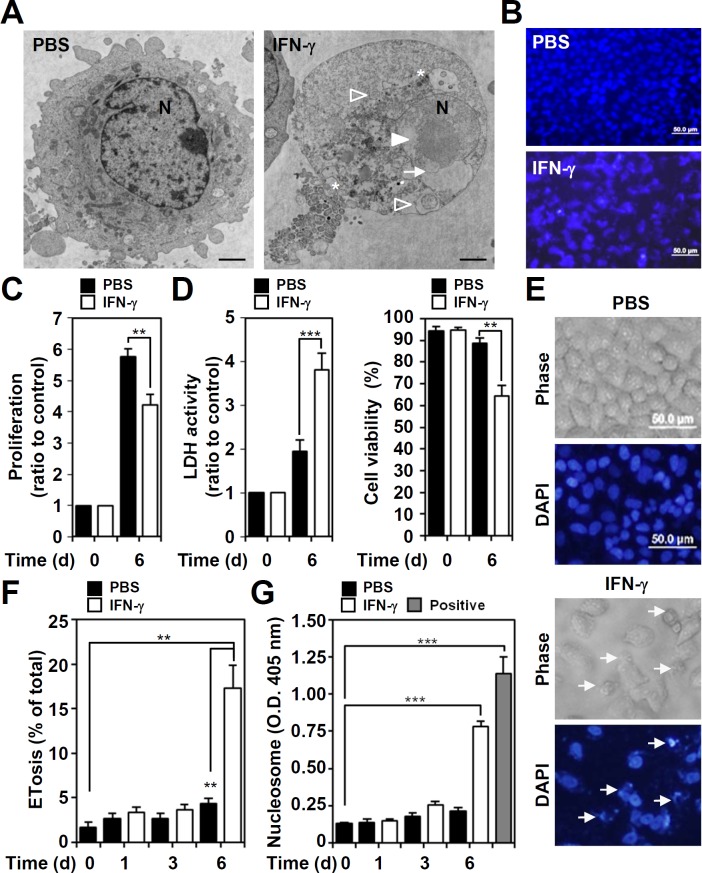
Fig 1. Exogenous IFN-γ causes cell proliferation inhibition and cytotoxicity characterized by a mimic ETosis.
(A) Analysis of transmission electron microscopy showed cytoplasmic vacuolization (stars), autolysosome accumulation (empty arrowheads), chromatin decondensation (filled arrowhead), and nuclear membrane disruption (arrow) in IFN-γ (10 ng/ml)-treated A549 cells for 6 days. N, nuclear. Scale bar, 500 nm. (B) Representative DAPI-based nuclear staining followed by fluorescence microscopic analysis showed a mimic ETosis (arrows) in IFN-γ (10 ng/ml)-treated A549 cells 6 days post-treatment. Cell proliferation (C), cell cytotoxicity (D, left), and viability (D, right) were measured in IFN-γ (10 ng/ml)-treated A549 cells for 6 days, and the data are presented as the mean ± SD of three independent experiments, which are shown as the fold change compared to the normalized value of the control or as the percentage of change. **P < 0.01 and ***P < 0.001. (E) Representative morphological change in IFN-γ (10 ng/ml)-treated A549 cells 6 days post-treatment showed a mimic ETosis (arrows) as indicated by DAPI-based nuclear staining followed by fluorescence microscopic analysis. (F) The percentages of cells with mimic ETosis for the indicated time are shown as the mean ± SD of three independent experiments. **P < 0.01. (G) ELISA was used to determine the levels of the extracellular nucleosomes, as a marker of ETosis, in the cell supernatants of IFN-γ (10 ng/ml)-treated cells for the indicated time. The optical density (O.D.) data for the nucleosomes are shown as the mean ± SD of three independent experiments. ***P < 0.001. The empty bar indicates the positive control obtained from the kit. PBS was used as the control for all experiments.

