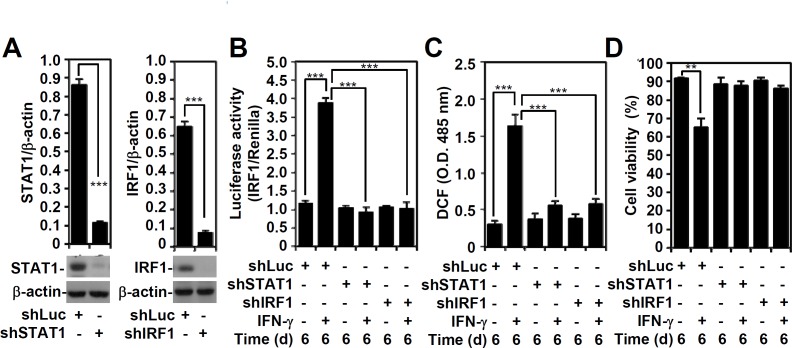
Fig 3. The effects of STAT1 and IRF1 on IFN-γ-induced transactivation of the IRF-1 promoter and on IFN-γ-induced ROS generation.
(A) A representative Western blot of the indicated proteins from A549 cells transfected with shRNA targeting luciferase (shLuc) and shRNA targeting STAT1 (shSTAT1) and IRF1 (shIRF1). β-actin was used as an internal control. The relative ratios of STAT1, IRF1, and β-actin are shown as the mean ± SD of three independent experiments. ***P < 0.001. (B) A luciferase reporter assay showed transactivation of IRF-1 in IFN-γ (10 ng/ml)-treated shLuc-, shSTAT1-, or shIRF-1-transfected A549 cells for 6 days. The ratio of IRF-1 to the Renilla control is shown, and the data are presented as the mean ± SD from three independent experiments. ***P < 0.001. (C) ROS generation in A549 cells was determined using CM-H2DCFDA staining followed by analysis using a fluorescent plate reader. The data are the mean ± SD of triplicate cultures and are shown as relative optical densities (O.D.). ***P < 0.001. (D) The trypan blue exclusion test was performed to assess cell viability. The data are presented as the mean ± SD of triplicate cultures and are shown as relative percentages. **P < 0.01.

