Fig. 3.
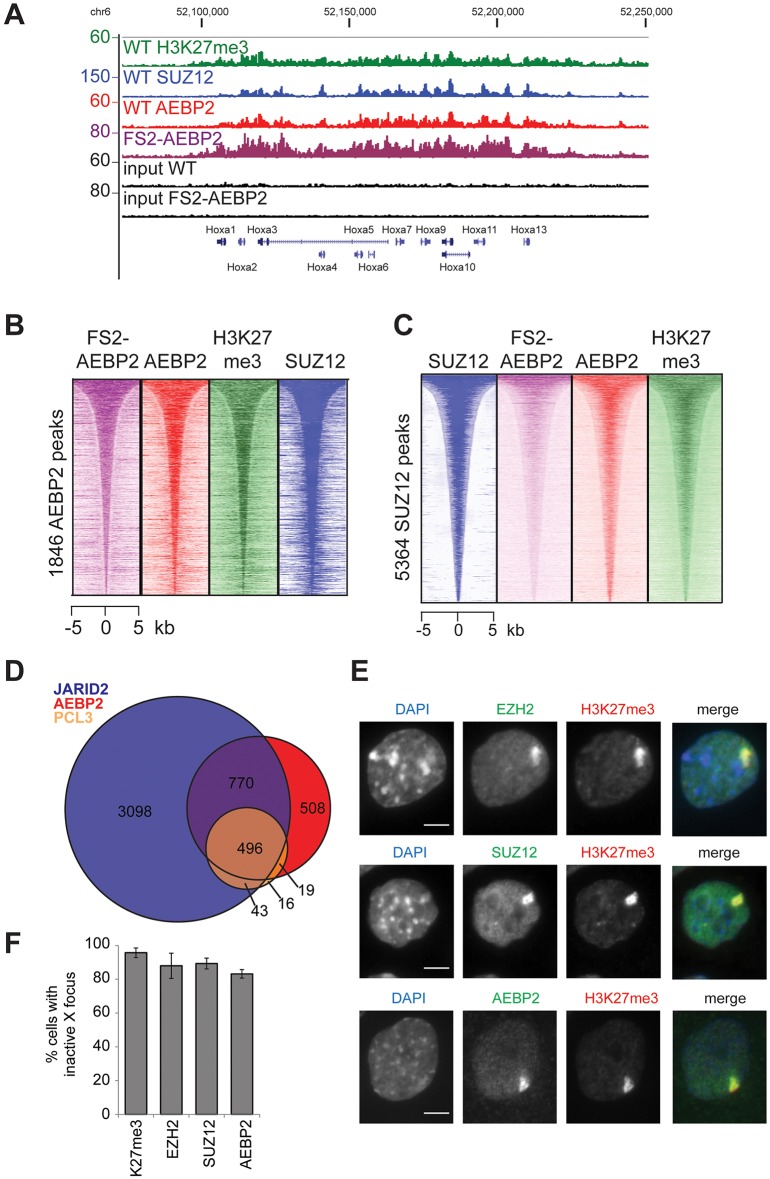
AEBP2 is enriched at PRC2 target sites. (A) ChIP-seq profile for SUZ12, H3K27me3, AEBP2 and input, and FS2-AEBP2 and input at the HoxA locus. Two repeats of ChIP-seq for the endogenous proteins were performed. Traces from one repeat are shown. (B) Heat-map analysis of AEBP2 peaks (1846), showing ChIP-seq signal for FS2-tagged AEBP2, AEBP2, H3K27me3 and SUZ12 at a 10 kb region centred over the AEBP2 peaks. (C) Heat-map analysis of SUZ12 peaks (5364), showing ChIP-seq signal for FS2-tagged AEBP2, AEBP2 and SUZ12 at a 10 kb region centred over the SUZ12 peaks. AEBP2 and FS2-AEBP2 are enriched at SUZ12 sites. (D) Overlap of peak datasets of JARID2 (Peng et al., 2009), AEBP2 and PCL3 (Brien et al., 2012). (E) Immunofluorescence images indicating overlap of H3K27me3, which marks the inactive X chromosome in trophoblast stem cells, and the PRC2 proteins EZH2, SUZ12 and AEBP2. Scale bar: 5 µm. (F) Quantification of the number of trophoblast stem cells observed with inactive X focus. A minimum of 300 cells were counted in three biological repeats. Error bars indicate s.d.

