Fig. 4.
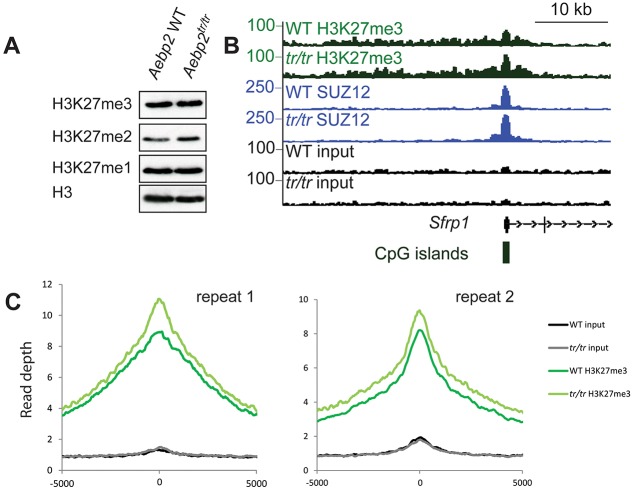
Aebp2tr/tr cells show a small increase in H3K27me3 at PRC2 target sites. (A) Immunoblot of global H3K27me0/1/2/3 levels in Aebp2 WT and Aebp2tr/tr mESCs. (B) ChIP-seq profile for H3K27me3, SUZ12 and input in Aebp2 WT and Aebp2tr/tr mESCs at the Sfrp1 gene. (C) A metaplot of H3K27me3 ChIP-seq signal at AEBP2 sites in Aebp2 WT and Aebp2tr/tr mESCs plotted across a 10 kb window for two repeats of the ChIP-seq experiment.

