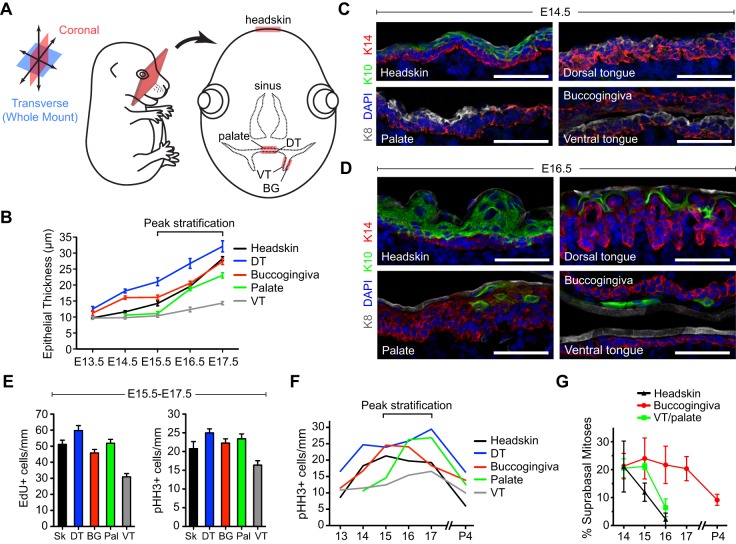
Fig. 1.
Oral epithelial stratification and proliferation are dynamic. (A) Visualizing oral epithelia (OE) in coronal sections. (B) E13.5-E17.5 OE/skin thickness. (C,D) Keratin expression in head and OE at E14.5 (C) and E16.5 (D), using basal (K14, red), suprabasal (K10, green), and periderm (K8, white) markers. (E) Proliferation rates during peak stratification, assessed by EdU incorporation (left) and levels of the G2/M marker pHH3 (right). (F) Proliferation rates during skin and OE development, representing aggregate pHH3+ cells/mm. All OE demonstrate higher proliferative activity postnatally compared with skin. (G) Suprabasal mitoses are transient during skin and ventral tongue (VT)/palate development but persist in buccogingival (BG) epithelia postnatally. (B,E,F) Data are derived from n=10-30 sections per tissue per age from n≥3 independent mouse embryos; (G) data are from 30-60 mitoses (from 3-6 embryos) per group. DT, dorsal tongue; Pal, palate; Sk, headskin. Scale bars: 50 µm.

