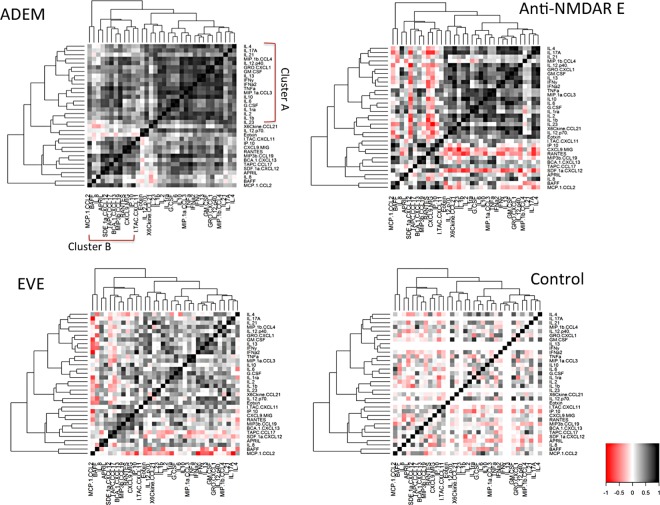
Fig 4. Hierarchical cluster analysis heat-map showing nearest-neighbour correlations of cytokines and chemokines in ADEM, anti-NMDAR E, EVE and controls.
Cytokines with positive correlations are represented in graded shades of black and negative correlations in graded shades of red. The same order of the analytes along axis is used for all the three heatmaps to allow comparisons. The clustering pattern showed some similarities (cluster A) in immune mediated encephalitis (ADEM and anti-NMDAR E), which was less observed in viral encephalitis and controls.

