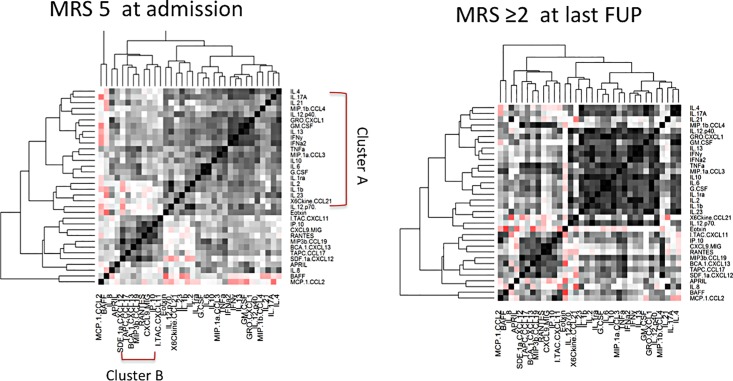
Fig 5. Heat map representation of cytokine/chemokine molecule interaction in the CSF of patients with all encephalitis with severe encephalopathy at admission (modified Rankin scale, MRS 5) and worse disability at follow up (MRS >2).
The cluster B molecules showed similar positive correlations between those with higher severity of encephalopathy and those with disability in follow up.

