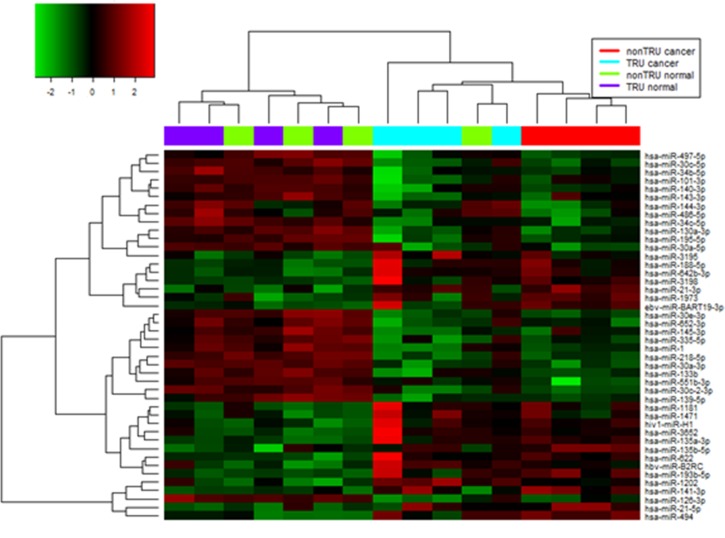
Fig 2. MiRNAs differentially expressed between lung adenocarcinoma vs. normal lung tissue.
Hierarchical clustering of 44 miRNA genes with significantly different expression (p<0.05) in tumor tissues. Rows and columns represent individual genes and tissue samples, respectively. The scale represents the intensity of gene expression (log2 ranges between −2.0 and 2.0).

