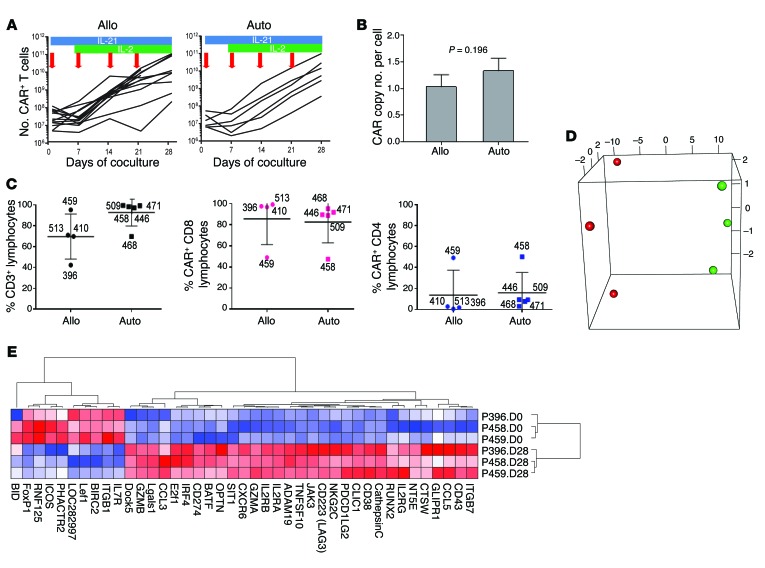
Figure 2. Characterization of genetically modified T cells after electrotransfer of SB plasmids to introduce CAR and coculture on AaPCs with cytokines.
(A) Lines represent the numerical expansion of SB-transformed CAR T cells cultured on AaPCs in the presence of cytokines. Blue bars represent exposure to IL-21 in culture, and green bars IL-2. Red arrows indicate the addition of γ-irradiated AaPCs to the coculture. Allogeneic and autologous samples are presented in the left and right panels, respectively, as labeled. Each line represents a specific study patient sample. (B) Graph represents CAR copy number per cell of genetically modified allogeneic (n = 19) and autologous (n = 7) CAR T cells for patients by qPCR. Bar, average ± SD. (C) The plot on the left shows the percentage of modified and expanded lymphocytes expressing CD3 for allogeneic (left side) and autologous (right side) lymphocytes prior to infusion. The heavy line for all similar panels reflects the mean value and the whiskers represent the SD. Numbers beside each marker identify the subject whose data are represented. The percentage of CD3+ lymphocytes expressing CD8 (middle panel) and CD4 (right panel) is shown. (D) PCA 3D plot of the first 3 principal components of the 41 differentially expressed genes in 6 samples; the first 3 principal components account for approximately 98.1% of the total variance (90.5%, 4.8%, and 2.8%) (red, day 0; green, day 28). (E) Cluster analysis of differentially expressed genes by gene pattern is shown, with up- and downregulated genes in culture-day-28 cells compared to unmanipulated culture-day-0 CD3+ T cells. Red, highest level of expression; white/pink, moderate level; blue, lowest level of expression.

