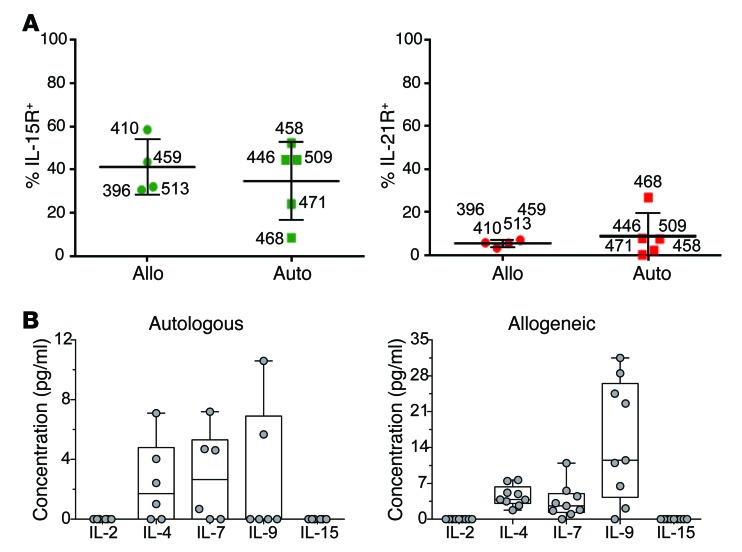
Figure 5. Cytokine milieu at the time of planned T cell infusions.
(A) Expression of cytokine receptors on administered T cells. The percentage of expanded CAR T cells expressing IL-15R (left panel) and IL-21R (right panel), determined by flow cytometry, is shown. Data are displayed as per similar panels of Figure 2. (B) Abundance of soluble cytokines that signal through the common cytokine receptor γ chain. The box and whiskers plots display the mean levels of each cytokine (pg/ml) in patient sera, while dots reflect the levels from individual patients, 12 hours after single CAR T cell infusions. Data from autologous and allogeneic recipients are shown on the left and right, respectively.

