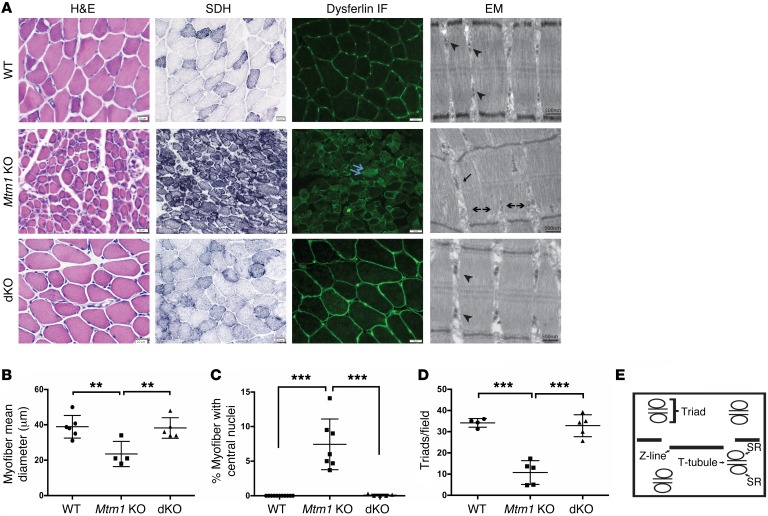
Figure 2. Restoration of normal muscle structure in Pik3c2b Mtm1 dKO mice.
(A) Cross sections from tibialis anterior muscle tissue of 35-day-old animals stained for H&E, SDH, and dysferlin. Mtm1 KO muscle has centrally located nuclei (arrow in H&E), mitochondrial aggregation and necklace myofibers on SDH staining (arrow), and abnormal distribution of dysferlin staining (double arrow). None of these changes were observed in muscle from dKO animals. Electron microscopic (EM) images reveal normal triad formation (arrowhead) in WT as well as dKO muscle but abnormal triads in Mtm1 KO with formation of longitudinal tubes (L-tubules, arrow) and absence of triads (double arrowhead). Scale bars: 20 μm; for EM: 500 nm. (B) dKO muscle has restored myofiber size, with average myofiber diameter for WT = 39 ± 5.8 μm (n = 6), for Mtm1 KO = 23 ± 4.1 μm (n = 4, **P < 0.01 vs. WT or dKO), and for dKO = 38 ± 4.3 μm (n = 5, P = 0.85 vs. WT). (C) Absence of central nuclei in the dKO. The average percent of central nuclei (per 100 fibers) in WT = 0% (n = 11), in Mtm1 KO = 7.4% ± 1.0% (n = 7, ***P < 0.001 vs. WT or dKO), and in dKO = 0.09% (n = 5, P = 0.2 vs. WT). (D) Quantification of number of triads per field. WT = 34 ± 3.1 (n = 4), Mtm1 KO = 10.7 ± 2.9 (n = 5, ***P < 0.001 vs. WT or dKO ), and dKO = 33 ± 4.6 (n = 5, P = 0.6 vs. WT). All comparisons in B–D done by 1-way ANOVA followed by Dunnett’s multicomparison test. (E) Schematic of the structure of triad with T-tubules, sarcoplasmic reticulum (SR), and the sarcomere ends (Z-line).

