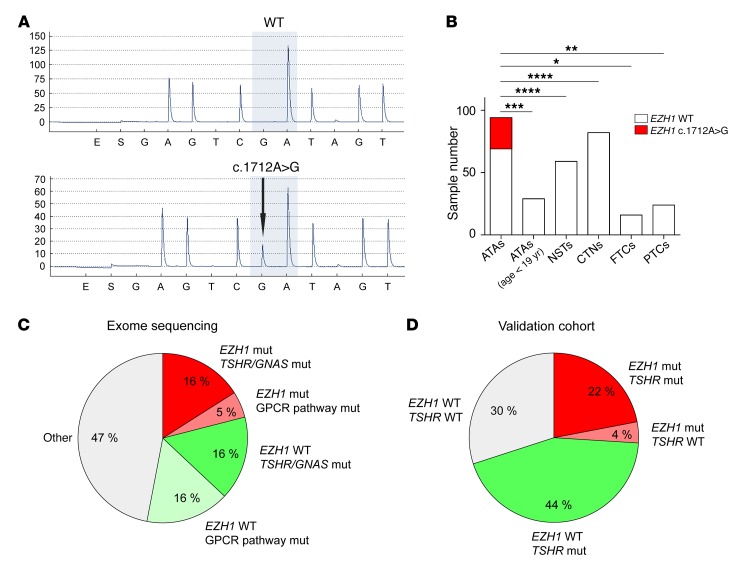
Figure 1. Identification of a hot-spot somatic EZH1 mutation in ATAs.
(A) Sequence chromatogram of an ATA sample carrying the heterozygous c.1712A>G mutation. A WT sample is shown for comparison. (B) Frequency of the EZH1 c.1712A>G mutation in different types of thyroid nodules. *P < 0.05, **P < 0.01, ***P < 0.001, and ****P < 0.0001 by χ2 test. (C and D) Grouping of the samples according to their mutational state in the exome-sequencing data (C) and validation cohort (D). mut, mutation.

