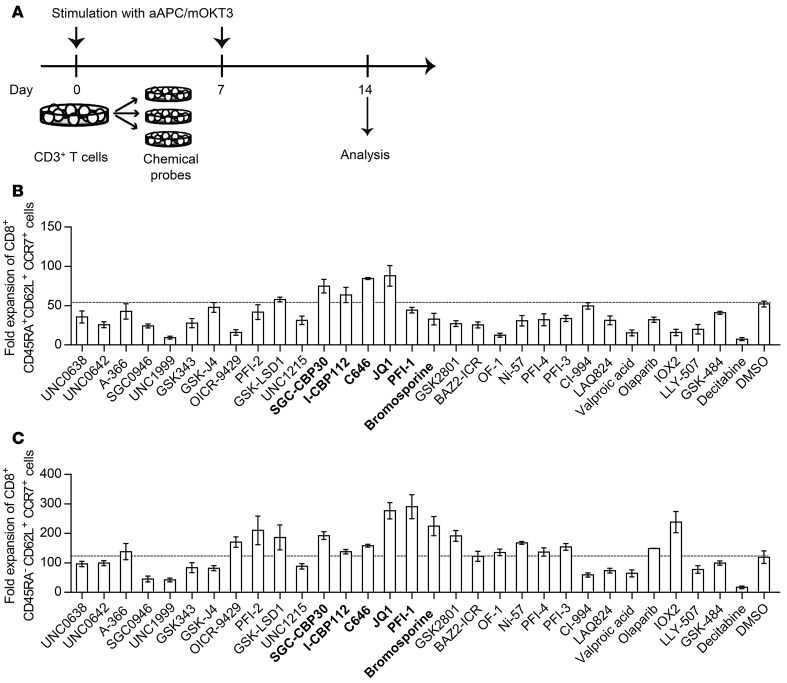
Figure 1. Screening of epigenetic targets that support the maintenance of CD45RA+CD62L+CCR7+ and CD45RA–CD62L+CCR7+ T cell phenotypes.
(A) Peripheral blood CD3+ T cells were stimulated with artificial antigen-presenting cells that express a membrane-bound form of anti-CD3 mAb (clone OKT3), CD80, and CD83 (aAPC/mOKT3), and the cells were subsequently treated with epigenetic chemical probes. The surface expression of CD45RA, CD62L, and CCR7 on CD8+ T cells was analyzed 14 days following the initial stimulation. (B and C) The fold expansion of CD45RA+CD62L+CCR7+ cells (B) and CD45RA–CD62L+CCR7+ cells (C) within the CD8+ T cell population treated with each chemical probe 14 days following TCR stimulation is shown. Inhibitors of p300 and BET proteins are indicated in bold. The error bars represent the SD of 3 technical replicates. The dotted lines indicate the mean values in DMSO-treated control wells.

