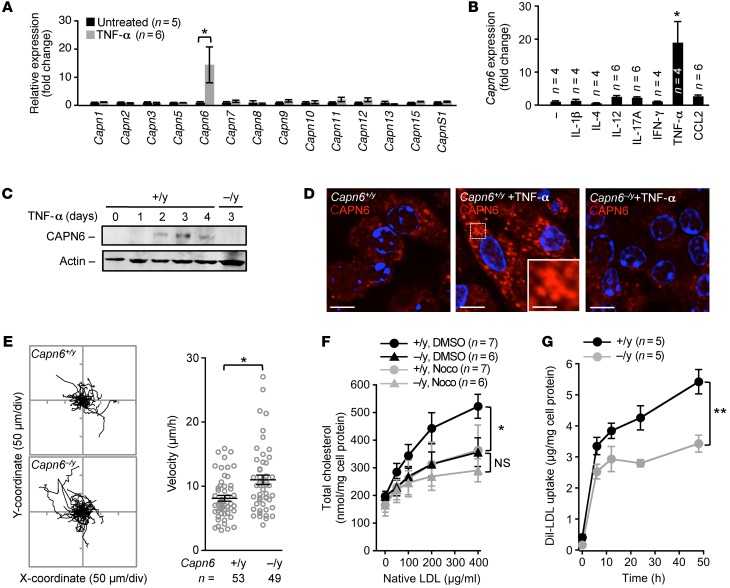
Figure 1. Loss of CAPN6 reduces the pinocytotic uptake of native LDL in macrophages.
BMMs at day 4 of differentiation were used in these experiments. (A) Expression of calpain family members in BMMs in response to TNF-α stimulus. (B) Expression of Capn6 mRNA in BMMs in response to variety of inflammatory stimuli. BM cells were stimulated with a variety of cytokines (IL-1β, IL-4, IL-12, IL-17A, IFN-γ, TNF-α, 10 ng/ml; or CCL2, 50 ng/ml) together with M-CSF at 50 ng/ml for 4 days. (C) CAPN6 protein expression in TNF-α/M-CSF–primed BMMs. One representative result of 3 independent experiments is shown. (D) Subcellular distribution of CAPN6 in TNF-α/M-CSF–primed Capn6+/yLdlr–/– BMMs. Capn6–/yLdlr–/– BMMs served as a negative control. Scale bars: 10 μm (D); 3 μm (insets).(E) Cellular movements in BMMs. TNF-α/M-CSF–primed BMMs were tracked for 10 hours in the presence of CCL2 at 50 ng/ml. (F) Uptake of native LDL in TNF-α/M-CSF–primed Capn6+/yLdlr–/– or Capn6–/yLdlr–/– BMMs. Cells were treated with native LDL for 24 hours at the concentrations indicated, either in the presence of DMSO or nocodazole (Noco) at 1 μmol/l. (G) Temporal changes in the uptake of Dil-labeled LDL in TNF-α/M-CSF–primed BMMs. **P < 0.01; *P < 0.05, 1-way ANOVA followed by Bonferroni’s test (A and B), Mann–Whitney U test (E), 2-way ANOVA (F and G). Error bars represent the mean ± SEM.

