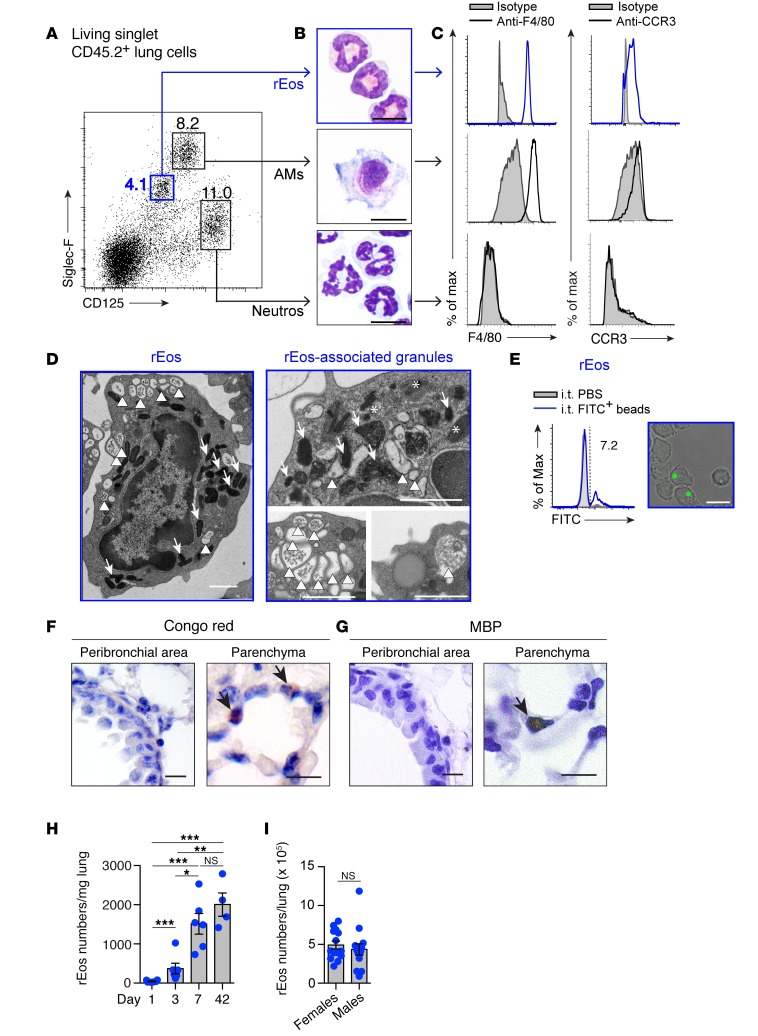
Figure 1. Characterization of lung rEos in naive C57BL/6 mice.
(A) Dot plot of lung leukocytes according to Siglec-F and CD125 expression. Numbers indicate the percentage of gated cells. Neutros, neutrophils. (B) Photographs of the FACS-sorted cell populations gated in A. (C) Histograms of F4/80 and CCR3 expression in the cell populations shown in B. (D) Representative electron microscopy photographs of rEos (left panel, representative of more than 100 individual cells analyzed) and rEos-associated granules (right panels). Arrows, asterisks, and arrowheads indicate secondary granules with high, intermediate, and low densities, respectively. (E) Phagocytic potential of rEos 6 hours after local i.t. instillation of fluorescent beads. Number indicates the percentage of bead-positive cells. (F) Congo red– and (G) MBP-stained lung sections. Arrows indicate Congo red– and MBP-positive eosinophils, respectively. (H) Kinetics of appearance of lung rEos after birth. (I) Absolute numbers of rEos in the lungs of female and male mice. (H and I) Results represent the mean ± SEM as well as individual values. *P < 0.05, **P < 0.01, and ***P < 0.001, by 1-way ANOVA, followed by Tukey’s test for multiple comparisons on log-transformed values (H) or by 2-tailed Student’s t test on square root–transformed values (I). Data in A–G are representative of 1 of more than 8 mice, each giving similar results. Data in H and I were pooled from 2 and 3 independent experiments, respectively (n = 4–6/group and 14/group, respectively). Scale bars: 1 μm (D) and 10 μm (B, E–G). Max, maximum.

