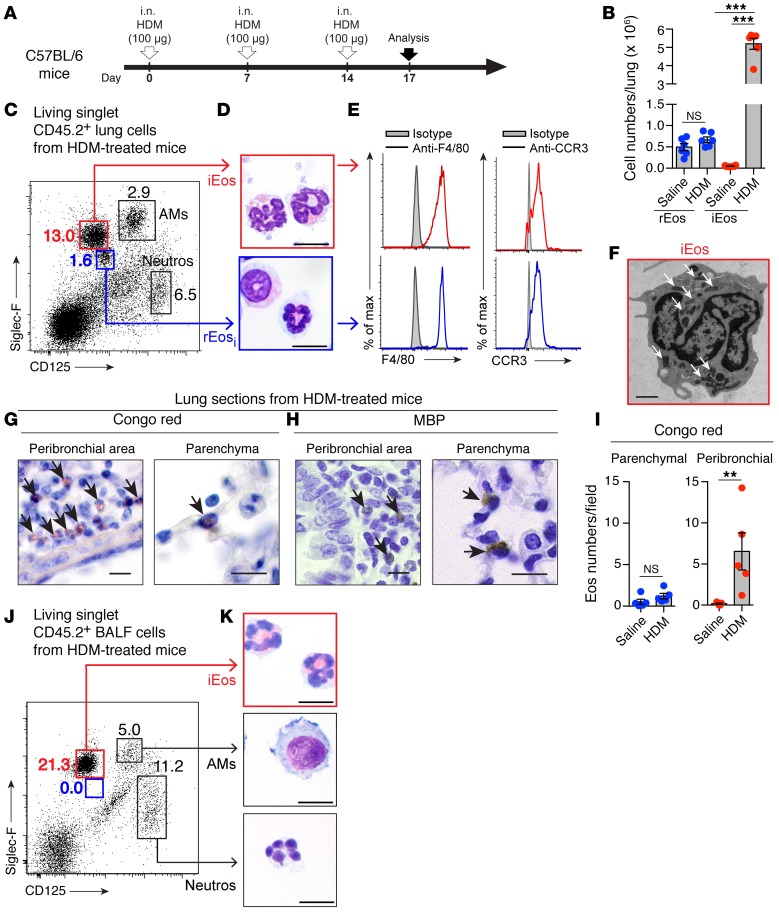
Figure 2. Characterization of lung rEos and iEos in HDM-challenged C57BL/6 mice.
(A) Experimental outline. i.n., intranasal. (B) Absolute numbers of lung eosinophil subsets. (C) Dot plot of lung leukocytes according to Siglec-F and CD125 expression. Numbers indicate the percentage of gated cells. (D) Photographs of the 2 lung eosinophil subsets. (E) Histograms of F4/80 and CCR3 expression in the cell populations shown in D. (F) Representative electron microscopy photograph of iEos (>100 individual cells analyzed). Arrows indicate secondary granules. (G) Congo red– and (H) MBP-stained lung sections. Arrows indicate Congo red– and MBP-positive eosinophils, respectively. (I) Quantification of parenchymal and peribronchial eosinophils in Congo red–stained lung sections. Eos, eosinophils. (J) Dot plot of BALF leukocytes according to Siglec-F and CD125 expression. Numbers indicate the percentage of gated cells. (K) Photographs of the gated cell populations in J. (B and I) Results represent the mean ± SEM as well as individual values (n = 5–6/group) and are representative of 1 of more than 4 independent experiments. **P < 0.01 and ***P < 0.001, by (B) a mixed-effects model, followed by Tukey’s test for multiple comparisons on log-transformed values, and (I) a Mann-Whitney U test. (C–H) Data are representative of 1 of more than 8 mice, each of them giving similar results. Scale bars: 10 μm (D, G, and H) and 1 μm (F). Neutros, neutrophils.

