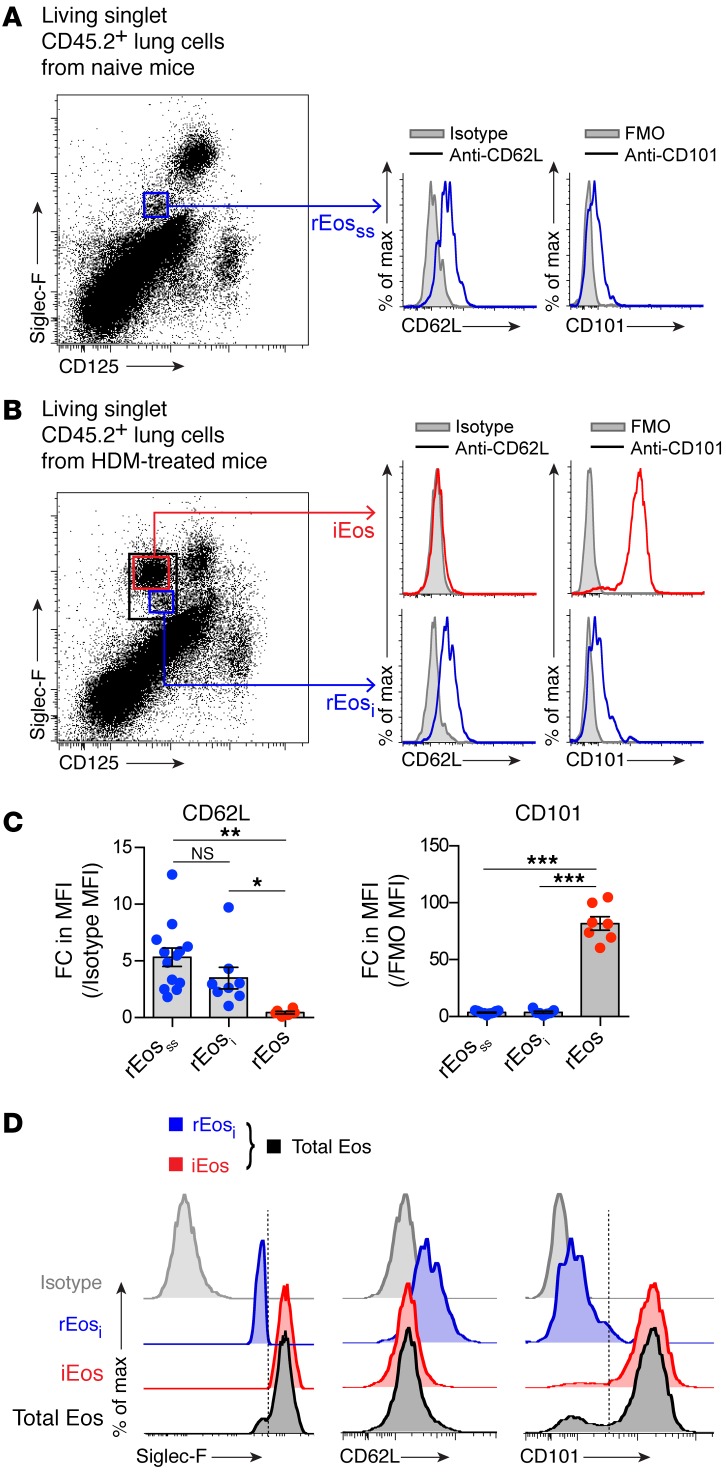
Figure 4. Identification of discriminating surface markers for mouse lung rEos and iEos.
(A and B) Representative flow cytometric histograms of CD62L and CD101 expression on (A) rEosss from naive C57BL/6 mice and (B) rEosi and iEos from HDM-treated allergic C57BL/6 mice. (C) Quantification of CD62L and CD101 expression levels on the surface of rEosss, rEosi, and iEos, expressed as the fold change (FC) increase in mean fluorescence intensity (MFI) as compared with the control MFI. Data represent the mean ± SEM as well as individual values and are pooled from 3 to 5 independent experiments (n = 7–13/group). (D) Histograms of CD62L and CD101 expression on rEosi (blue) and iEos (red) and total lung eosinophils (Siglec-Fint/hiCD125int, black) from HDM-treated allergic C57BL/6 mice. (C) *P < 0.05, **P < 0.01, and ***P < 0.001, by 1-way ANOVA, followed by Tukey’s test for multiple comparisons. FMO, fluorescence minus 1.

