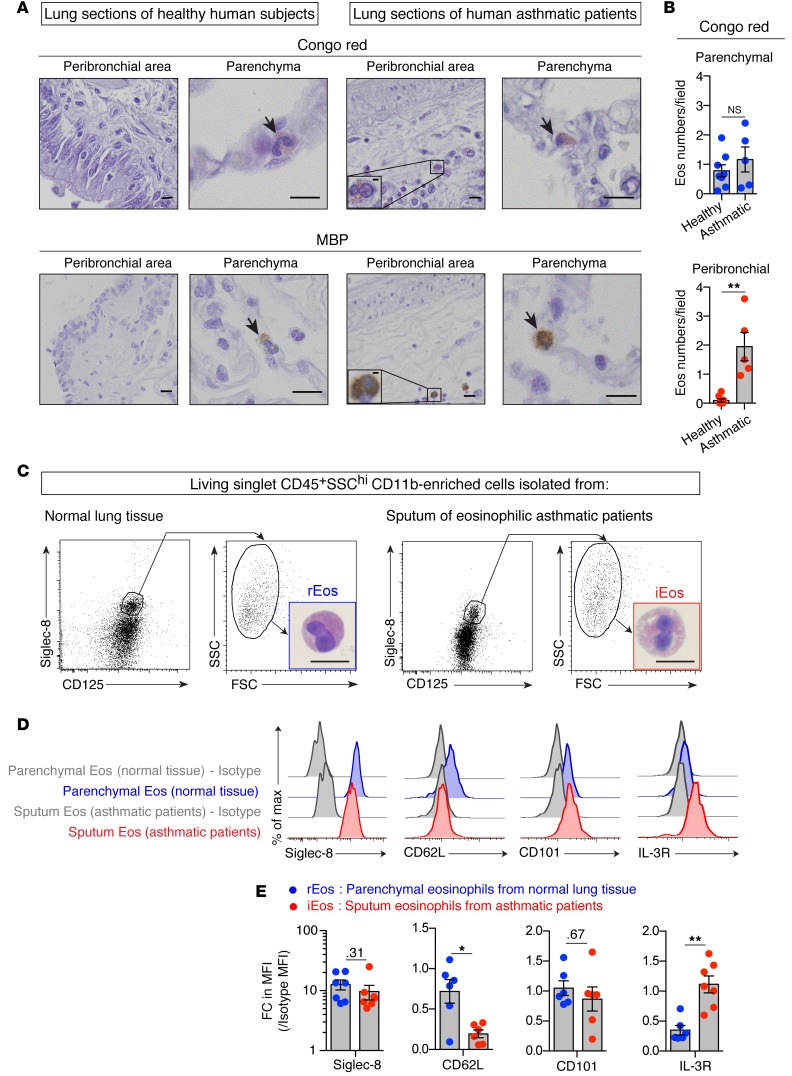
Figure 8. Localization, morphology, and phenotype of lung rEos and iEos in humans.
(A) Representative Congo red– and MBP-stained lung sections of healthy human donors and asthmatic patients. Arrows indicate Congo red– and MBP-positive eosinophils, respectively. (B) Quantification of parenchymal and peribronchial eosinophils in Congo red–stained lung sections. Eos, eosinophils. (C–E) Parenchymal eosinophils from normal lung tissue (rEos) and eosinophils from the sputa of eosinophilic asthmatic patients (iEos) were analyzed morphologically and phenotypically. (C) Dot plots of living singlet CD45+SSChi cells according to surface Siglec-8 and CD125 expression. Insets depict a representative photograph of FACS-sorted rEos and iEos. (D) Representative flow cytometric histograms of Siglec-8, CD62L, CD101, and IL-3R expression on rEos and iEos. (E) Quantification of Siglec-8, CD62L, CD101, and IL-3R expression levels on the surface of rEos and iEos, expressed as the FC increase in MFI as compared with the control MFI. Number are the P values for comparisons that were not significant (P > 0.05). (B and E) Data shown represent the mean ± SEM as well as individual values. Each dot represents a single individual analyzed (n = 5–8/group) (see also Supplemental Methods and Supplemental Tables 1–3). *P <0.05 and **P < 0.01, by nonparametric Mann-Whitney U test. Scale bars: 10 μm and 2 μm (insets in A).

