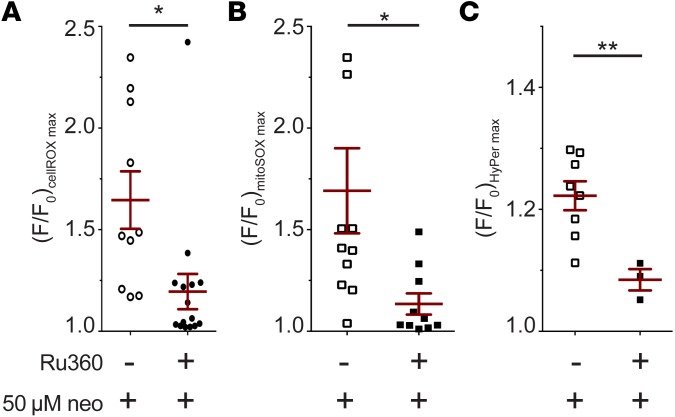
Figure 6. Pharmacological inhibition of mitochondrial Ca2+ uptake reduces overall change in oxidative state of hair cells exposed to aminoglycosides.
(A–C) Maximal transformed (F/F0) fluorescence intensity of cellROX (A), mitoSOX (B), and HyPer (C) in cells following exposure to 50 μM neomycin and the mitochondrial uniporter inhibitor Ru360. Data shown are only for dying cells. Hair cells were first loaded with the indicated dye (if applicable) for 30 minutes, followed by 30-minute exposure to Ru360. They were then mounted on the microscope stage for imaging and exposed to Ru360 and/or neomycin, while fluorescence readings were recorded. Horizontal lines and error bars represent mean ± 1 SEM (A–C) Student’s t test, Welch’s correction; *P < 0.05, **P < 0.01; n = 10 (A, neomycin alone) 16 (A, neomycin + Ru360), 11 (B, neomycin alone), 10 (B, neomycin + Ru360), 8 (C, neomycin alone), and 3 (C, neomycin + Ru360) neuromasts.

