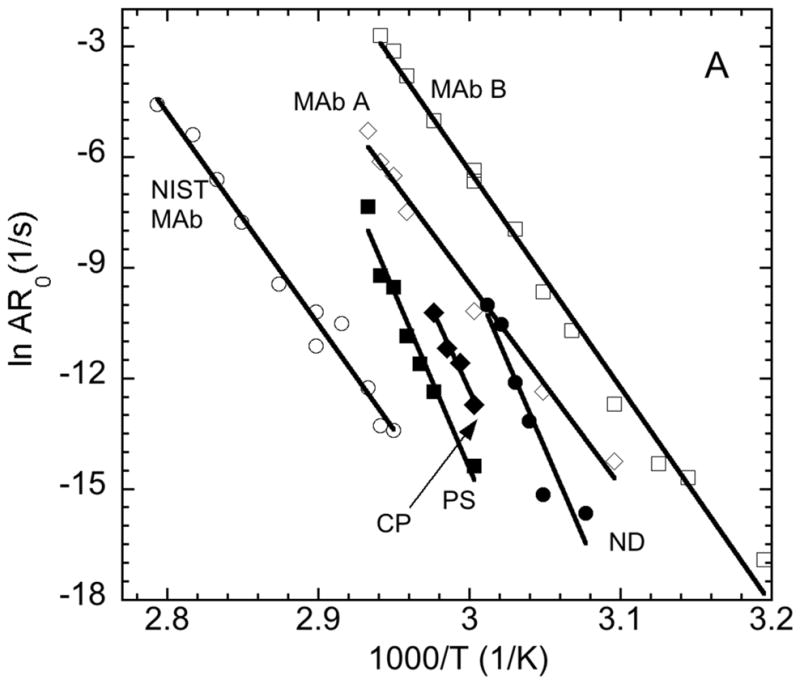
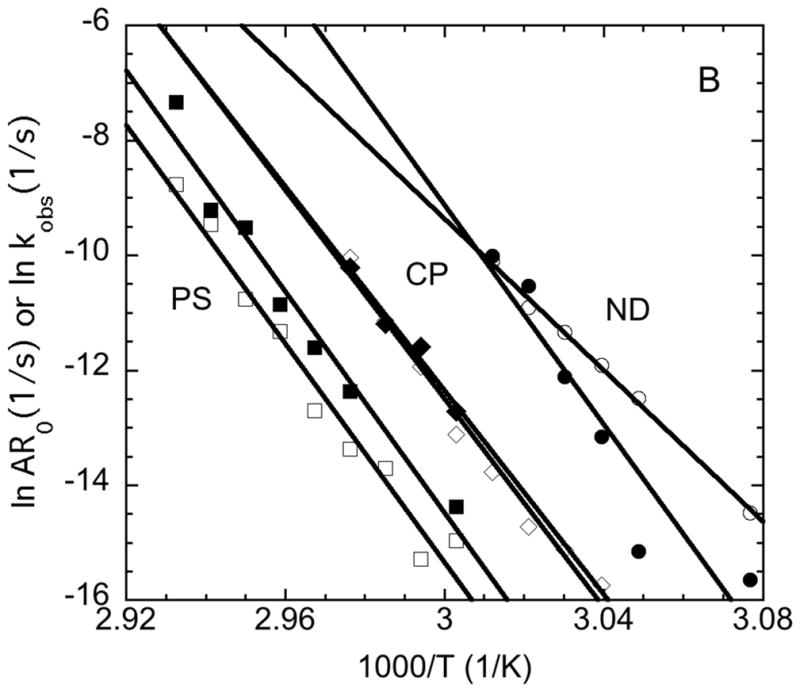
Figure 7.


Arrhenius diagrams (A) comparing AR0 vs. inverse temperature for AS-IgG1 under ND, CP, and PS conditions versus previous data for three other monoclonal antibodies (see data labels and main text for details), and (B) comparing AR0 (closed symbols) vs. kobs (open symbols) for AS-IgG1 for ND (circles), CP (diamonds), and PS (squares) conditions.
