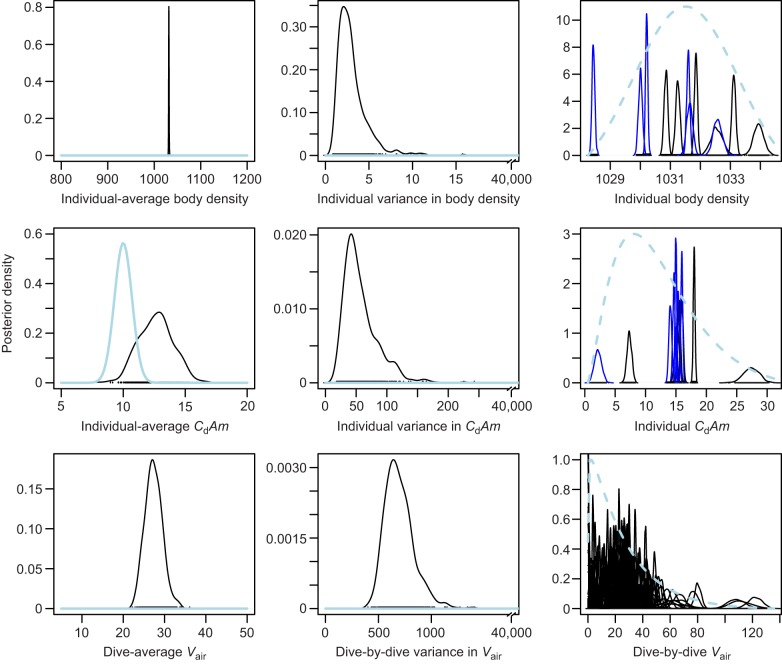
Fig. 3.
Prior and posterior distributions from the best model with the lowest deviance information criterion (DIC). The left and middle panels show the global or ‘population’ parameters (shared across all dives and individuals) and the right panel shows the individual and dive-specific parameters. Solid blue and black lines show the prior and posterior distributions, respectively. Note the x-axis break in the middle panel, which indicates the wide prior range for the between-group variances. Dashed blue lines (right panel) indicate the estimated global distributions, derived from the posterior mean value for the global average (left panel, e.g. individual-average body density) and the global variance (middle panel, e.g. inter-individual variance in body density). This distribution can be interpreted as the population distribution for that parameter.

