
Fig. 4.
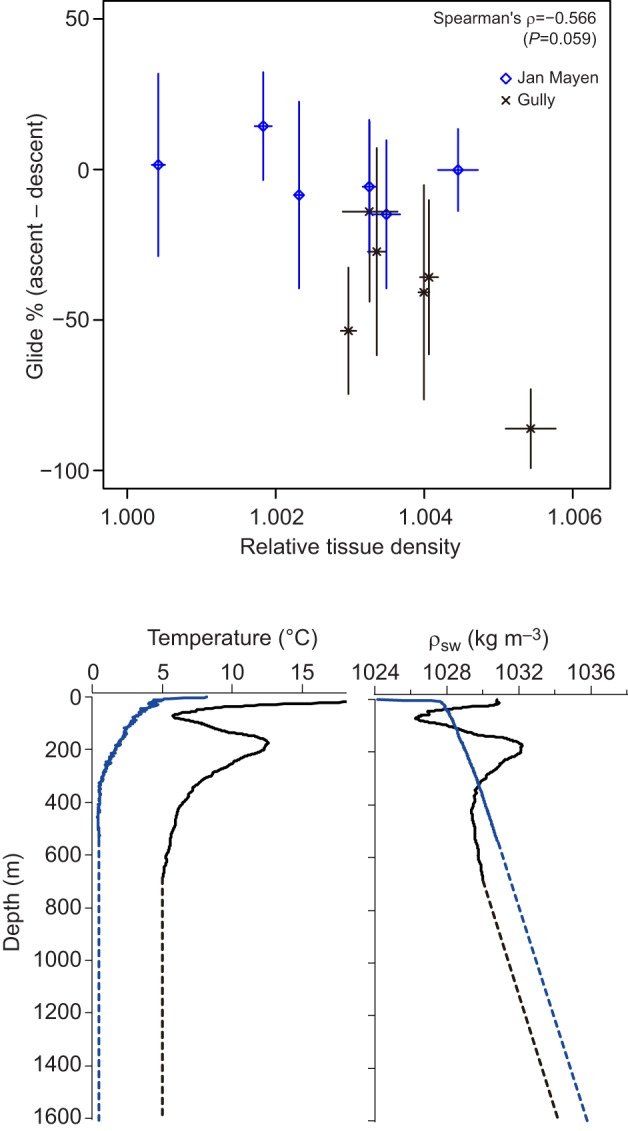
Gliding patterns of whales versus tissue body density. Top: difference in percentage of time spent gliding in ascent versus descent phases at depths >100 m as a function of tissue density of tagged northern bottlenose whales relative to ambient seawater density. Greater relative body density values indicate greater negative buoyancy of the whales, while values close to 1.0 indicate near-neutral buoyancy. Error bars on the x-axis indicate the 95% credible interval of body density; those on the y-axis indicate the standard deviation of gliding percentages across dives, with negative values indicating more gliding during the descent phase, and values near zero indicating equal proportions of gliding during descent and ascent phases. Note the strong expected relationship that denser animals glide relatively less during the ascent phase (more during descent), which is the transit direction aided by buoyancy. Bottom: temperature (left) and seawater density (ρsw, right) profiles. Blue and black lines represent Jan Mayen (24 June 2014) and the Gully (4 September 2013) profiles, respectively. Conductivity–temperature–depth (CTD) profiles were measured up to around 600 m for both study sites. Salinity and temperature were assumed to remain constant at greater depths (dashed line).