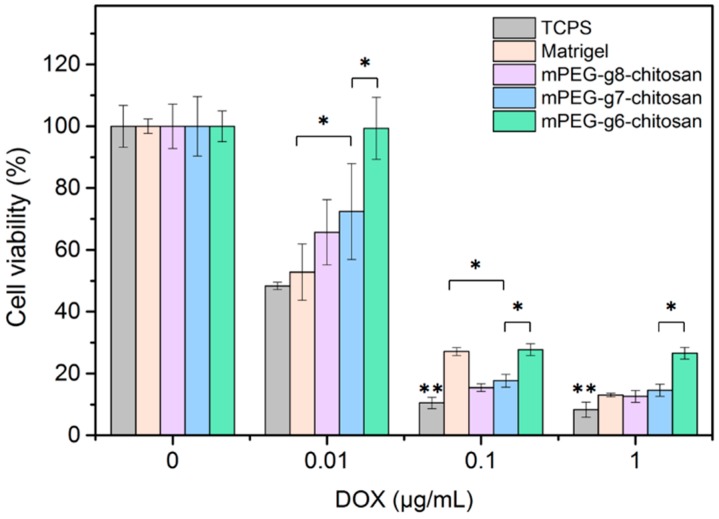
Figure 7.
Assessment of MMC cell drug response when cultured on TCPS, Matrigel, and mPEG-g-chitosan hydrogels with 6%, 7%, and 8% PEGylation. Results are presented as mean ± standard deviation and * indicates significant difference (p < 0.05); ** indicates significant difference compared with all other conditions (p < 0.05).

