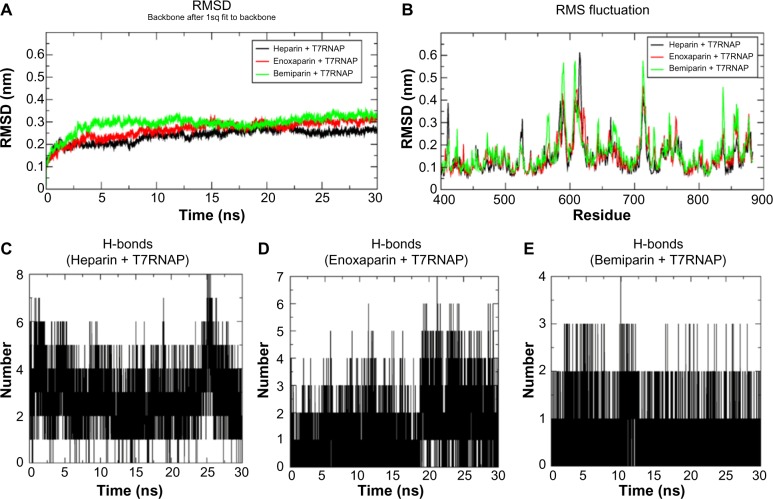
Figure 4.
MD simulation results at 30 ns timescale: (A) comparative analysis of RMSD (backbone) with time for heparin, enoxaparin, and bemiparin complexes with T7RNAP, (B) RMS fluctuation of palm and finger subdomain residues of all three complexes during the 30 ns simulation. The number of hydrogen bonds formed between receptor and ligand in the three complexes with (C) heparin, (D) enoxaparin, and (E) bemiparin is shown.

