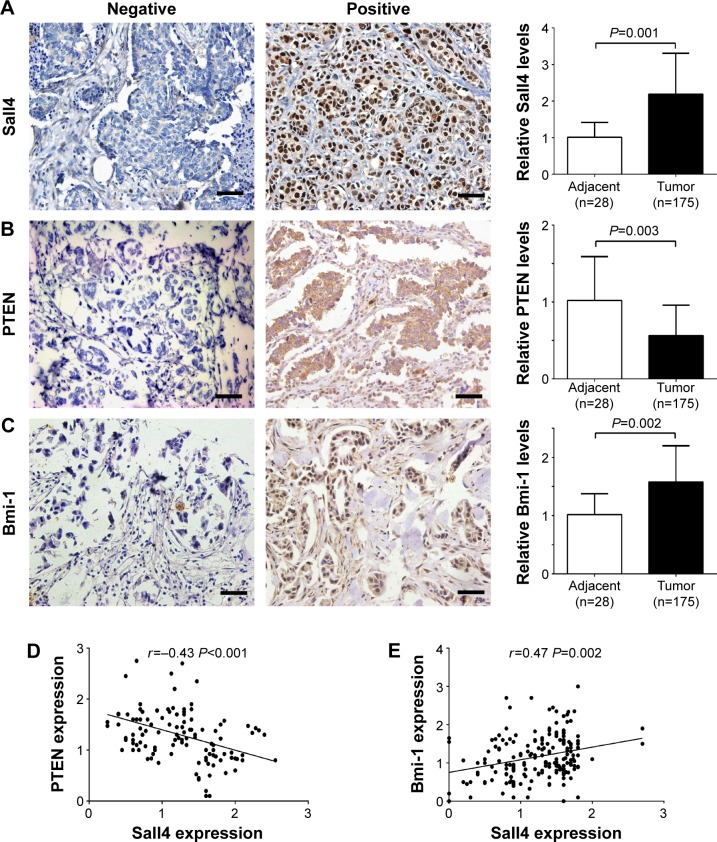
Figure 1.
The expression of Sall4, PTEN, and Bmi-1 in intrahepatic cholangiocarcinoma and adjacent tissues.
Notes: (A) Representative images of Sall4 expression with negative and positive staining (left), and quantification of relative expression in tumor and adjacent tissues. Bar =100 μm; magnification 100×. (B) Representative images of PTEN expression with negative and positive staining (left), and quantification of relative expression in tumor and adjacent tissues. Scale bar =100 μm; magnification 100×. (C) Representative images of Bmi-1 expression with negative and positive staining (left), and quantification of relative expression in tumor and adjacent tissues. Scale bar =100 μm; magnification 100×. (D) Pearson correlation analysis for the correlation between Sall4 and PTEN in intrahepatic cholangiocarcinoma. (E) Pearson correlation analysis for the correlation between Sall4 and Bmi-1 in intrahepatic cholangiocarcinoma. Data are expressed by mean ± SD.
Abbreviation: SD, standard deviation.

