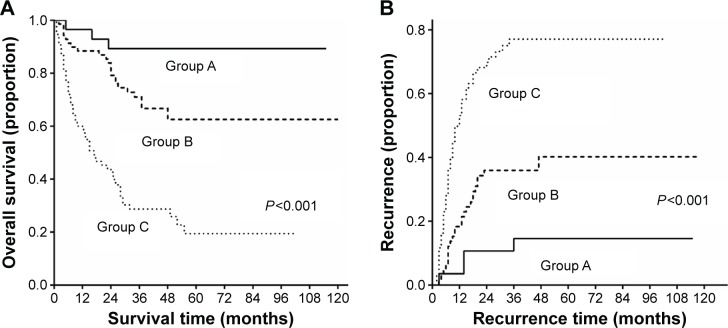
Figure 7.
Kaplan–Meier curves for OS (A) and recurrence (B) of the subgroup study stratification of patients according to AGR and tumor size.
Notes: Group A (AGR ≥1.48 and tumor size <5 cm, n=28). Group B (AGR ≥1.48 but tumor size ≥5 cm, or tumor size <5 cm but AGR <1.48, n=69), and Group C (AGR <1.48 and tumor size ≥5 cm, n=75). The P-values were calculated by log-rank test.
Abbreviations: OS, overall survival; AGR, albumin/globulin ratio.

