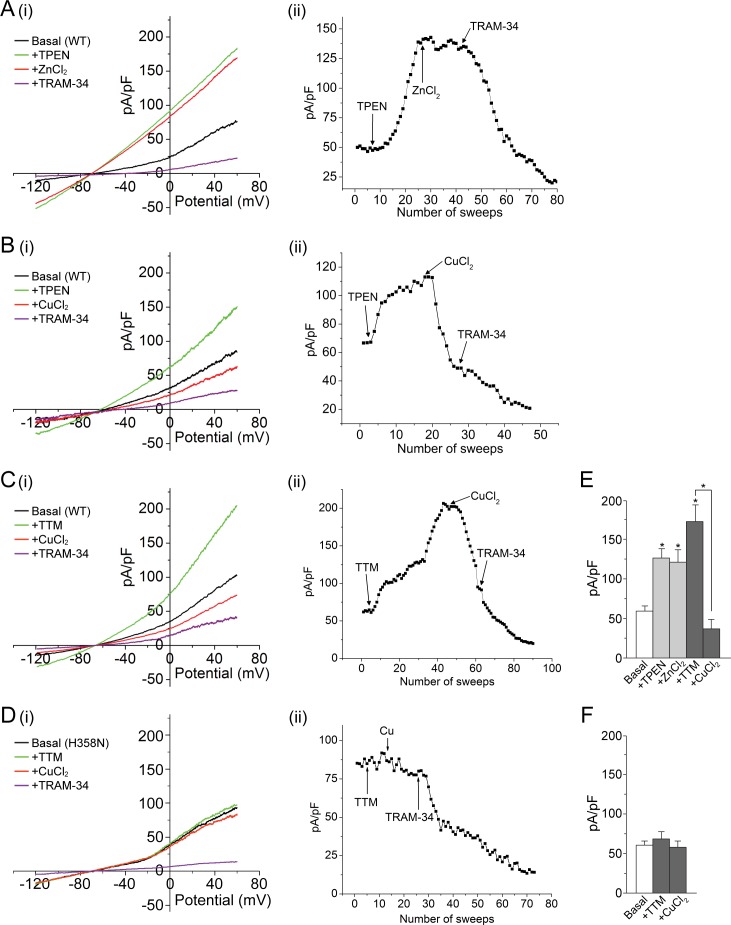
Figure 1. Metal chelators activate and copper inhibits KCa3.1 in whole-cell membrane patches.
(A–D) (i) Representative current vs. voltage (IV) plot recorded from a 293-KCa3.1(WT) cell (A–C) or a 293-KCa3.1(H358N) cell (D). After obtaining the basal current, TPEN (20 µM) (A, B) or TTM (20 µM) (C, D) was perfused in the bath solution, followed by the addition of either ZnCl2 (100 µM) (A) or CuCl2 (100 µM) (B–D), and then TRAM-34 (1 µM). (A–D) (ii) Representative trace of current (pA/pF) recorded at +60 mV using ramp protocol applied every 10 s (sweep frequency). The timing of additions (TPEN, CuCl2, etc.) is indicated by the arrows. (E, F) Summary bar graph of TRAM-34-sensitive current at +60 mV for data measured from 293-KCa3.1(WT) cells (E) or from 293-KCa3.1(H358N) cells (F). In (E), +ZnCl2 is to be compared with +TPEN (i.e. ZnCl2 added after treatment with TPEN), and +CuCl2 with +TTM (i.e. CuCl2 added after treatment with TTM). Data are displayed as mean ± the standard error of the mean (SEM) (n = 10 (E) or 8 (F) cells). *p≤0.01 versus Basal and for +CuCl2 versus +TTM.

