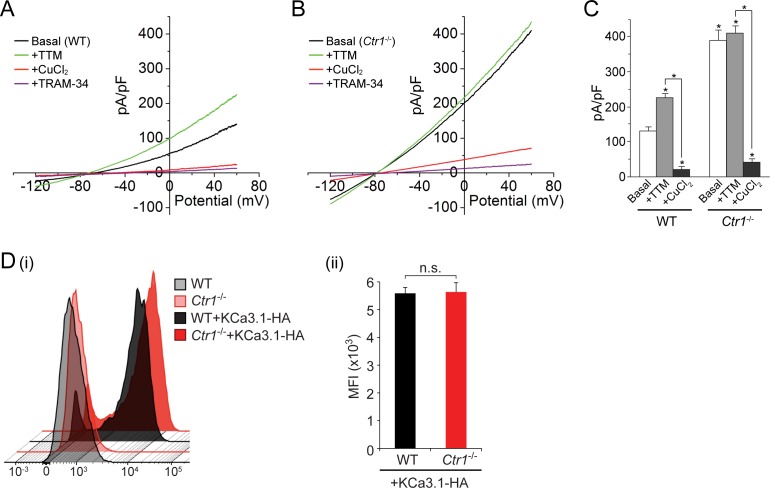
Figure 4. Basal KCa3.1 current is elevated in transfected MEFs from Ctr1-/- mice.
(A, B) Representative current vs. voltage (IV) plot recorded from a KCa3.1-transfected MEF from a wild-type (WT) mouse (A) or a Ctr1-/-(B) mouse. After obtaining the basal current, TTM (20 µM) was perfused in the bath solution followed by CuCl2 (10 µM) and then TRAM-34 (1 µM). (C) Summary bar graph of the TRAM-34-sensitive current at +60 mV for data measured from MEFs from WT or Ctr1-/- mice. For statistical analysis, one-way-ANOVA was used, and the Bonferroni test was applied to compare the mean values. Data are displayed as mean ± SEM (n = 10 cells). *p≤0.01 versus Basal in WT MEFs and for +CuCl2 versus +TTM. (D) Exofacial HA-tagged KCa3.1 was transfected into WT or Ctr1-/- MEFs, and cell surface expression was assessed by FACs analysis following staining with anti-HA antibodies and with anti-mouse FITC antibodies in non-permeabilized cells. (i) Flow cytometry results of WT and Ctr1-/- controls stained with only the secondary anti-mouse FITC antibody, or of WT + KCa3.1-HA and Ctr1-/- + KCa3.1-HA MEFs stained with both anti-HA and anti-mouse FITC antibodies. (ii) Mean fluorescence intensity (MFI) of WT + KCa3.1-HA and Ctr1-/- + KCa3.1-HA MEFs.

