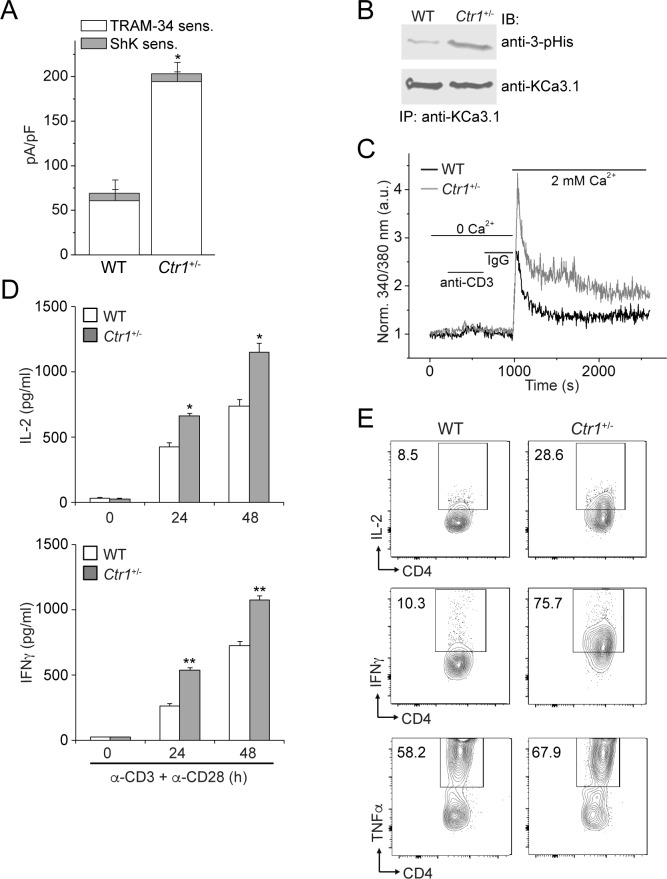
Figure 5. CD4+ T cells from Ctr1+/- mice are hyperactivated.
Naive CD4+ T cells were isolated from spleens of wild-type (WT) or Ctr1+/- mice and activated with anti-CD3 and -CD28 antibodies for 48 hr. (A) KCa3.1 channel activity was determined by whole-cell patch clamping as in Figure 1. Shown is a summary bar graph of TRAM-34 (1 µM; KCa3.1) and ShK (1 nM; Kv1.3)-sensitive currents at +60 mV (n = 12 (WT) or 15 (Ctr1+/-)). For statistical analysis, one-way-ANOVA was used, and the Bonferroni test was applied to compare the mean values. Data are displayed as mean ± SEM (n = 10 cells). *p≤0.01 vs TRAM-34-sensitive current in WT. (B) KCa3.1 was immunoprecipitated from lysates of CD4+ T cells from WT or Ctr1+/- mice and probed with a monoclonal antibody to 3-pHis (clone SC56-2) or KCa3.1 as indicated. (C) Activated cells were rested overnight, loaded with Fura-2, AM and attached to a poly-L-lysine-coated coverslip for 20 min. Calcium imaging was then performed in unstimulated cells and following stimulation with anti-CD3 and -CD28 antibodies (n = 80–100 cells). (D) ELISA to quantify IL-2 and IFN-γ in the supernatants. Statistical significance was calculated using Student’s t-test (*p<0.05, **p<0.01, n.s.: p>0.05; not significant as compared to WT). (E) Representative intracellular flow cytometry detecting cytokine expression following restimulation with anti-CD3 and -CD28 antibodies in the presence of brefeldin-A for 4 hr. Cells not re-stimulated with anti-CD3 and -CD28 were stained and analyzed in a similar manner and served as controls for setting the cut-off limits for cytokine production. Data are representative of two independent experiments.

