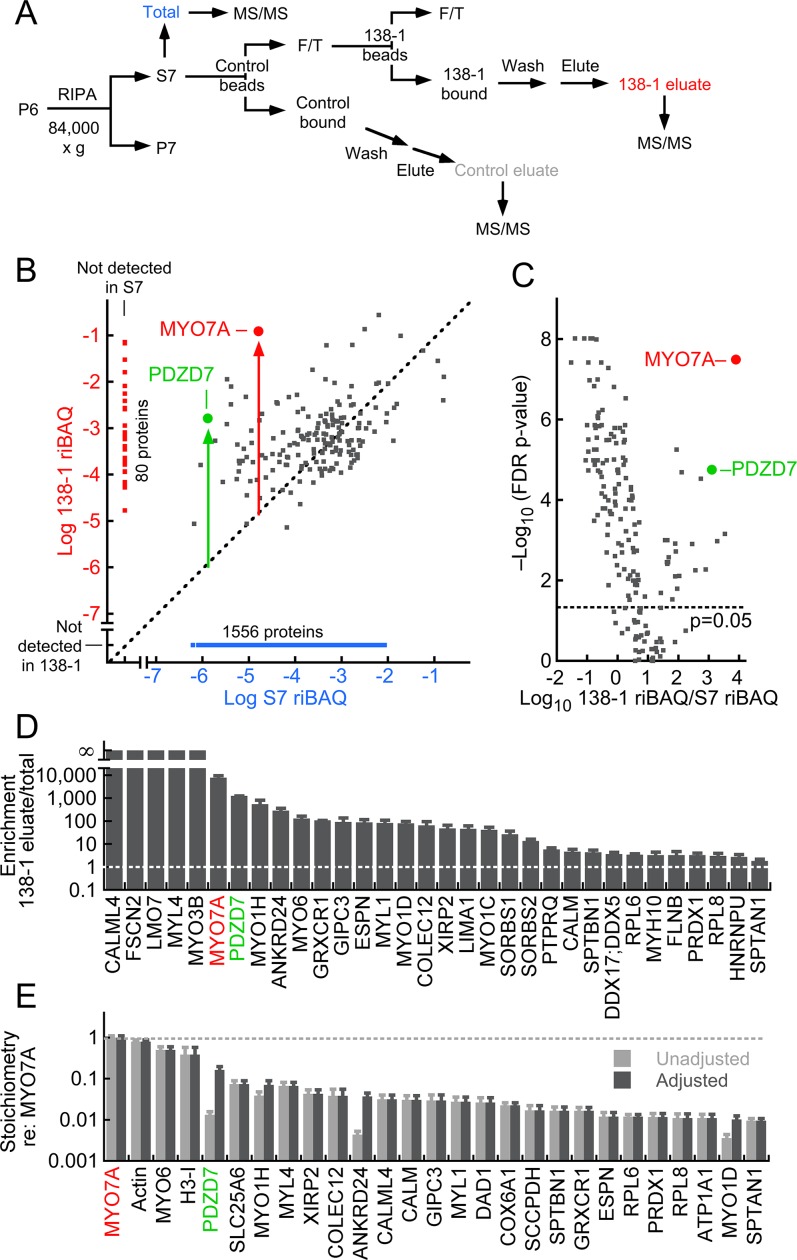
Figure 3. MYO7A immunoaffinity purification from D10 enriched membranes.
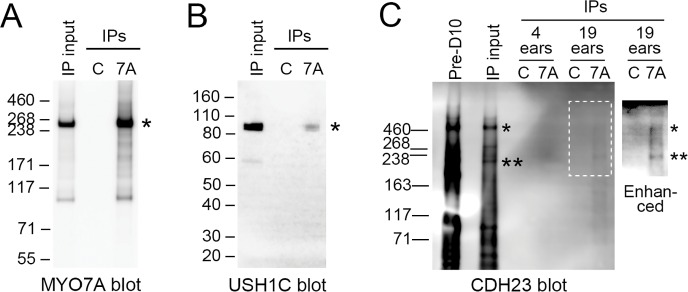
(A) Flow chart describing immunoaffinity purification strategy using the 138-1 monoclonal antibody, which recognizes chicken MYO7A. Mass spectrometry was carried out on the total (S7; RIPA-soluble fraction), 138-1 eluate, and control eluate. F/T, unbound material; MS/MS, tandem mass spectrometry analysis. (B–E) Shotgun proteomics analysis of 138-1 immunoaffinity purification. (B) Relative protein levels of 1719 proteins detected in at least one run of total or 138-1 eluate. Distance from the diagonal unity line (gray dashed) indicates enrichment by 138-1; note that MYO7A (red symbol) and PDZD7 (green) are highly enriched. (C) Volcano plot illustrating enrichment and statistical significance. The x-axis displays the log10 of each protein’s enrichment by 138-1 immunoprecipitation relative to the S7 starting material, while the y-axis indicates the log10 value of the FDR (false discovery rate) adjusted p-value for that enrichment value. Dashed line indicates significance at p=0.05. (D) Top 32 proteins in 138-1 eluates by enrichment. Only proteins not detected in control runs and detected in at least four of six 138-1 runs are displayed. (E) Top 27 proteins in 138-1 eluates by stoichiometry relative to MYO7A. Only proteins detected in at least four of six 138-1 runs are displayed; proteins detected in control eluates (e.g., actin) were also included. Unadjusted stoichiometry: (138-1 riBAQ for protein of interest)/(138-1 riBAQ for MYO7A). Adjusted stoichiometry: (unadjusted stoichiometry) × (total riBAQ for MYO7A)/(total riBAQ for protein of interest). Figure 3—figure supplement 1 displays an immunoblot analysis of the 138-1 immunoprecipitation, examining MYO7A and its Usher syndrome partners USH1C and CDH23.
DOI: http://dx.doi.org/10.7554/eLife.18312.011


